


Crude Oil and Its Another Interesting Relationship
Commodities / Crude Oil Jul 06, 2018 - 09:40 PM GMTBy: Nadia_Simmons

 Tuesday's unsuccessful attempt to break above upper borders of the rising trend channels cost oil bulls more than many buyers expected. Their weakness was quickly detected by therivals, who took control during yesterday's session. The effects of their attackare seen not only on the crude oil charts, because they also affected the pronunciation of our next interesting ratio. Is it possible that the relationship betweenblack gold and the general stock market will give us valuable tipson the future of light crude as it happened many times in the past?
Let’s take a closer look at the charts below (charts courtesy of http://stockcharts.com).
Technical Picture of Crude Oil
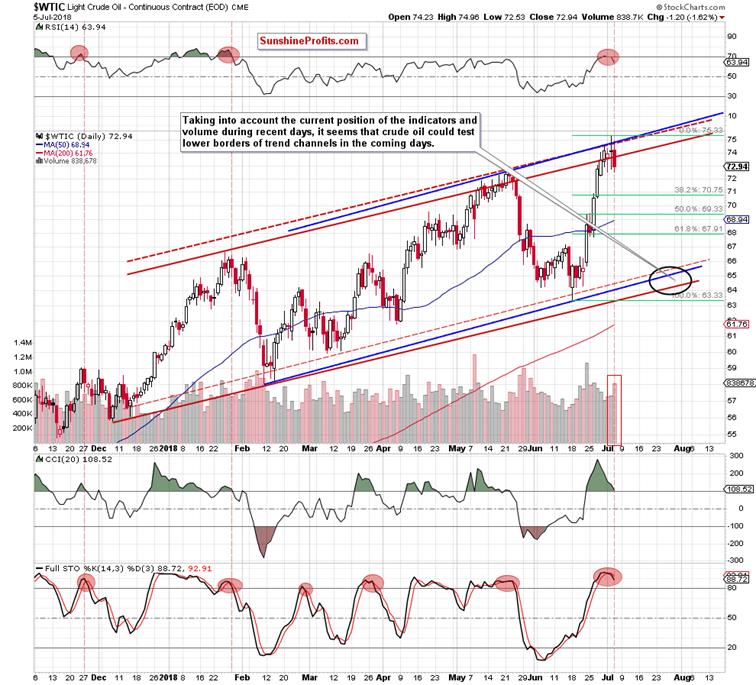
In our yesterday’s Oil Trading Alert, we wrote that although the price of crude oil broke above the upper line of the blue rising trend channel and the red dashed resistance line (the upper line of the red dashed trend channel based on daily openings), not everything went as well as bulls planned.
The buyers’ weakness just after the breakout encouraged oil bears to act, which resulted in a pullback that took the commodity below both previously-broken lines. Thanks to this invalidation of the breakout, market participants created a quite big doji candlestick, which emphasizes the investors' indecision about the direction of another move.
Although oil bulls showed strength in previous days, the candles they created in the previous week from day to day were getting smaller, which in combination with the falling volume (we wrote more about this issue in our last week’s alerts) suggested that the rally was running out of steam.
Additionally, the RSI climbed above the level of 70 (we didn’t see such high reading of the indicator since late January), the CCI deepened the bearish divergence, while the Stochastic Oscillator generated a shy sale signal. All the above-mentioned arguments, increased the probability that further deterioration is just around the corner.
From today’s point of view, we see that the situation developed in line with the above scenario and crude oil moved quite sharply lower during yesterday’s session. Thanks to the oil bears’ attack, the price of the commodity only re-tested the strength of the upper borders of the aforementionedrising trend channels, but then reversed and declined.
As a result, black gold also slipped under the previously-broken upper line of the red rising trend channel (based on an intraday highs and lows), invalidating the earlier breakout. It is worth emphasizing here that we could observe a similar price action in May.
Similarity to May
Back then, crude oil extended losses very quickly as oil bears showed their strength on the following days. The consequence of their pro-declining activity was a downward move, which took the price of light crude not only below the barrier of $70, but also erased most of the April-May increases.
Will history repeat itself once again? In our opinion, it is very likely, and we have 7 important arguments that support the pro-bearish scenario.
The Reasons
First, the above-mentioned invalidations of the breakouts above the upper borders of 3 rising trend channels.
Second, higher volume during yesterday’s session (compared to what we saw during recent upswings), which significantly increases the likelihood that bears are starting to get stronger.
Third, the RSIjoined the Stochastic Oscillatorand also generated a sale signal.
Fourth, the overall situation in the long term (we wrote more about this issue on July 2, 2018).
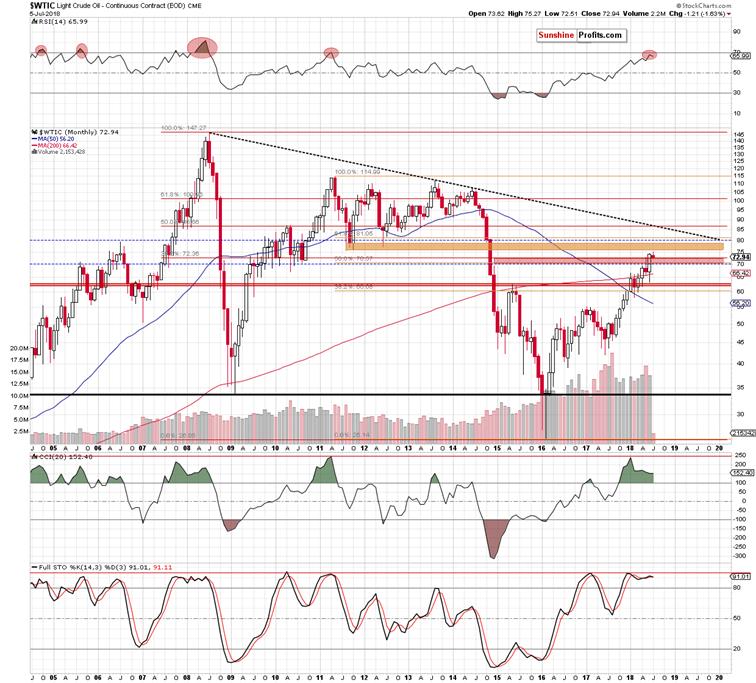
As you see on the above chart, the proximity to the next resistance zone (created by the August 2011, October 2011 and June 2012 lows), which begins at the level of $75.71 (only 44 cents above this month’s peak) also favors oil bears and their plans.
Fifth, the relationship below black gold and the S&P 500 described below.
Relationship Between Crude Oil and General Stock Market
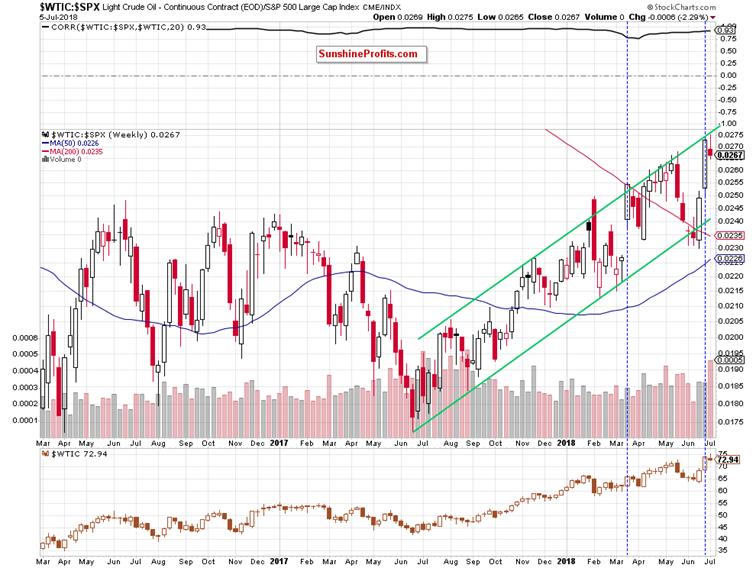
The first that caches the eye on the above chart is another unsuccessful attempt to go above the upper border of the green rising trend channel. As you see, although the buyers pushed the ratio sharply higher in the previous weeks, this major resistance line stopped them – similarly to what we saw 12 times in the past!
From this perspective, we additionally see that despite breakouts inFebruary, March and at the end of April, the ratio didn’t manage to move higher, which translated into declines in the following week(s).
What’s even more interesting, the bulls fought fiercely with this resistance for just over a month (between mid-April and the last candle closing the week of May 21), but all their efforts ended in failure.As a result, the value of the ratio dropped sharply, reaching the lower border of the green risingtrend channelin the following weeks.
What does it mean for the price of crude oil?
Taking into account a very strong positive correlation between light crude and the ratio (please note that it is even stronger than in previous months), we believe that another decline in the ratio will be reflected in the fall in oil prices.
Are there any technical factors suggesting declines in the ratio? Oh yes, they are. Let’s take a look at the short-term chart below.
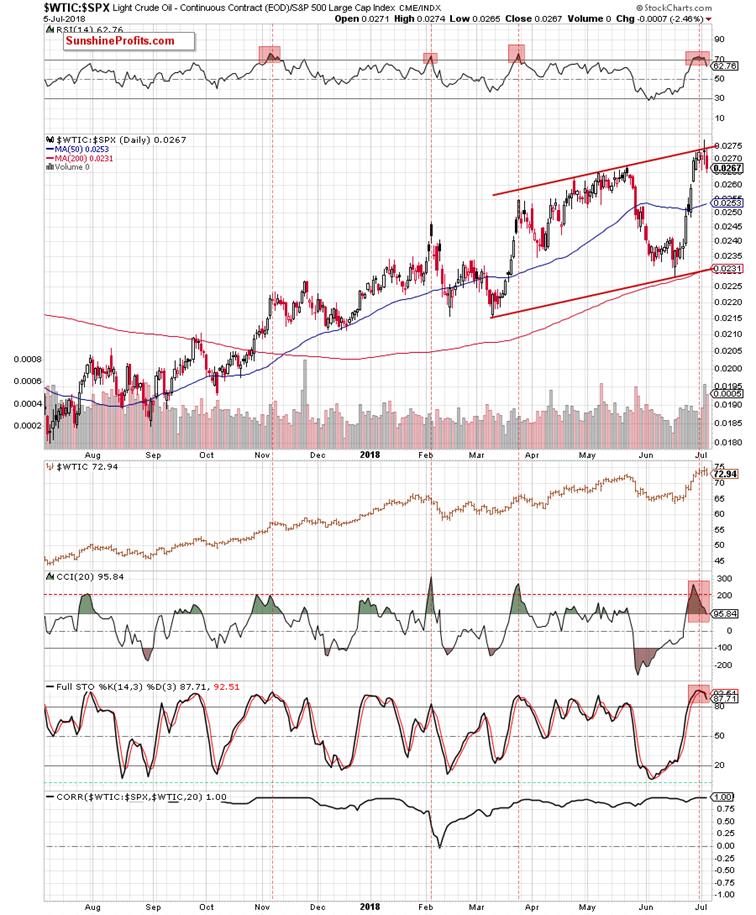
Looking at the daily chart, we see that the ratio invalidated the earlier breakout above the upper border of the red rising trend channel, which doesn’t bode well for the bulls. Additionally, all daily indicators generated the sell signals, giving the sellers even more reasons to act.
At this point, it is worth noting that over the last year, the RSI generated the sell signals (except yesterday) only 3 times. What happened in the following days? In all cases, we could observe smaller or larger drops, which significantly increases the probability of further deterioration in the ratio and also in the case of crude oil – especially when we factor in the fact that the correlation between the price of the commodity and the value of the ratio is even higher on a daily basis than on a weekly basis.
And speaking about crude oil relationships…. the sixth reason for further declines isthe correlation between light crude and the oil-to-gold ratio.
Crude Oil – Precious Metals Link
On Monday, we wrote the following:
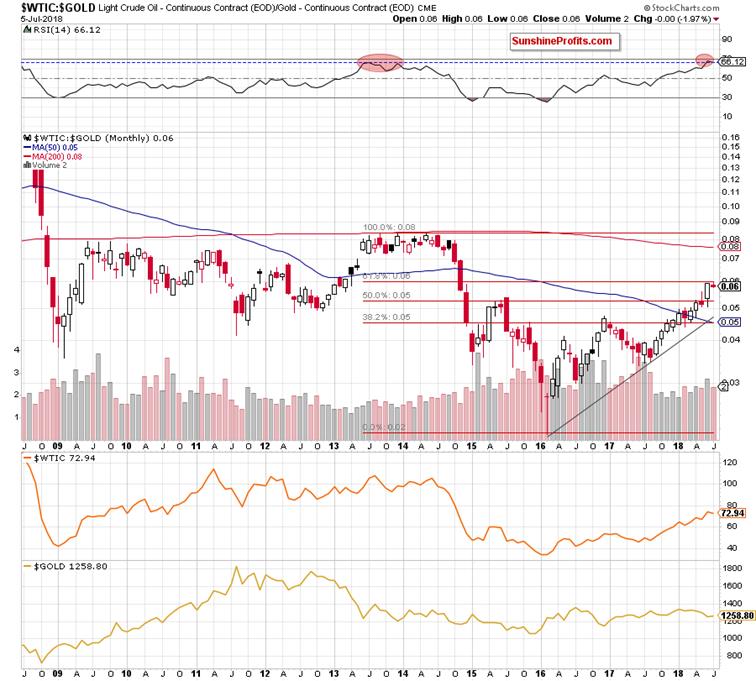
(…) the ratio approached the 61.8% Fibonacci retracement based on the entire 2013-2016 downward move, which suggests that even if the ratio moves slightly higher, the space for gains may be limited by this important resistance in the very near future.
Additionally, the RSI climbed to its highest level since 2013 (…) such high reading of the indicator (we marked it with the red ellipse) preceded a multi-month consolidation and, in fact, a strong downward move that allowed our readers to increase their profits.
On the monthly chart, we see that although the ratio moved higher earlier this month, the 61.8% Fibonacci retracement withstood the buying pressure, triggering a pullback.
What impact did this drop have on the medium-term chart?
Before we comment on this question, let us recall the quote from our last essay:
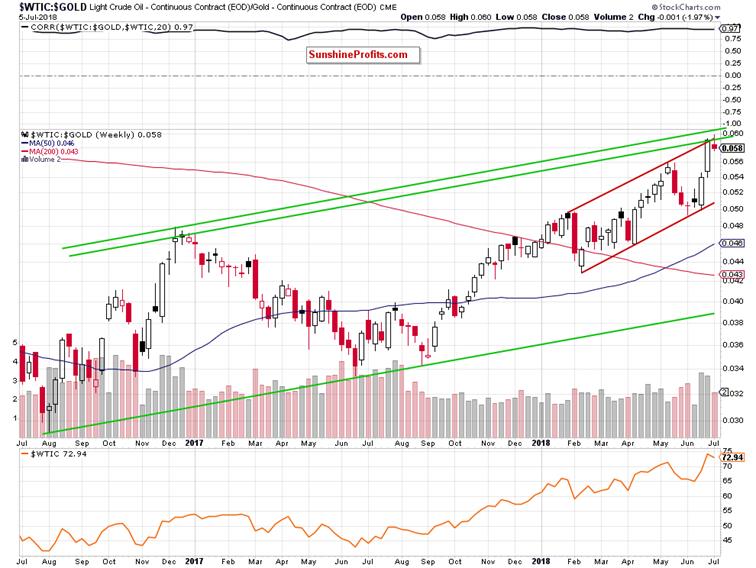
(…) it climbed to the resistance area created by two important resistance lines: the upper line of the red rising trend channel and the upper border of the long-term green rising trend channel.
(…) what does this have to do with the price of crude oil? As it turned out many times in the past, it has quite a lot in common. Why? As you can see on the above chart, the level of correlation between the price of light crude and the ratio is very high (0.96), which means that the potential reversal in the case of ratio can also translate into a reversal in the case of black gold – just like it has already happened many times in similar cases.
As you see on the above chart, history repeated itself once again as the ratio and crude oil fell in line this week, invalidating the earlier breakout above these resistance lines, which gives the bears another points in the fight for lower levels.
Can we infer something more from the daily chart?
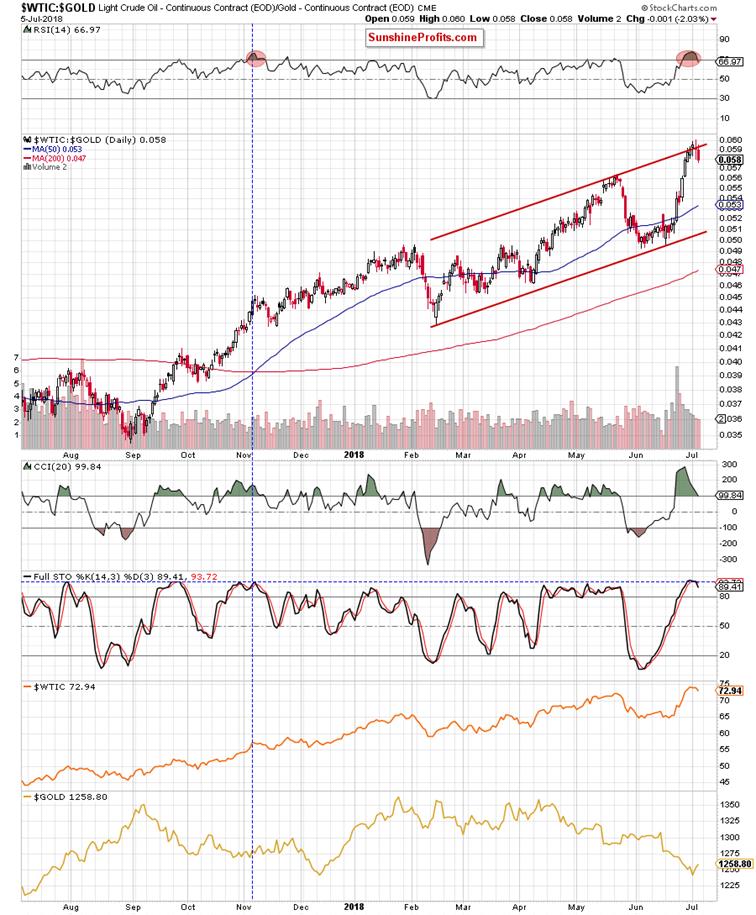
From this point of view, you can see more clearly an invalidation of the breakout above the red rising trend channeland also the sell signals generated by the indicators. At this point, please note that we saw a similar reading of the RSI only once during the last year. Back then, it preceded a correction, which took place in the following days, which means that something similar in the coming week should not surprise us.
Having said that, let’s focus on the seventh solid argument that can be used by oil bears to push the price of light crude downnext week. What do we mean? The relationship between crude oil and silver.
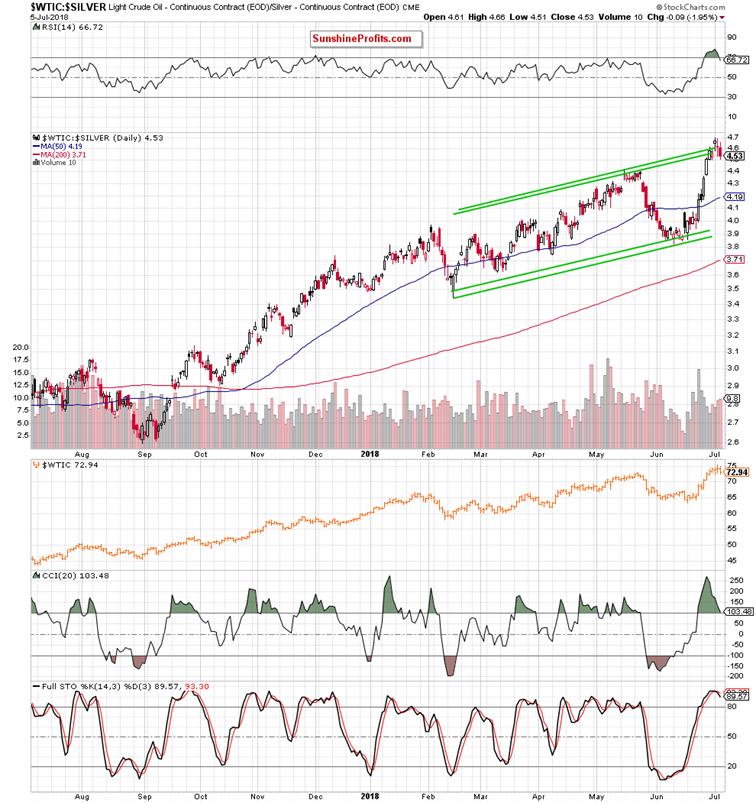
In this case, we can also observe an invalidation of the earlier breakout above important resistance lines (the upper lines of the green rising trend channels in terms of an intraday highs/lows and daily opening/closures) and the sell signals generated by the daily indicators.
Nevertheless, when we take a closer look at the above chart, we can notice one more bearish sign – rising volume during recent declines, which only increases the likelihood of another move to the south.
Summing up, yesterday, crude oil invalidated one more breakout on higher volume, which in combination with the picture that emerges after analyzing the current situation in all individual ratios suggests that another bigger move is very likely in the coming week.
If you enjoyed the above analysis and would like to receive free follow-ups, we encourage you to sign up for our daily newsletter – it’s free and if you don’t like it, you can unsubscribe with just 2 clicks. If you sign up today, you’ll also get 7 days of free access to our premium daily Oil Trading Alerts as well as Gold & Silver Trading Alerts. Sign up now.
Nadia Simmons
Forex & Oil Trading Strategist
Przemyslaw Radomski
Founder, Editor-in-chief
Sunshine Profits: Gold & Silver, Forex, Bitcoin, Crude Oil & Stocks
Stay updated: sign up for our free mailing list today
* * * * *
Disclaimer
All essays, research and information found above represent analyses and opinions of Nadia Simmons and Sunshine Profits' associates only. As such, it may prove wrong and be a subject to change without notice. Opinions and analyses were based on data available to authors of respective essays at the time of writing. Although the information provided above is based on careful research and sources that are believed to be accurate, Nadia Simmons and his associates do not guarantee the accuracy or thoroughness of the data or information reported. The opinions published above are neither an offer nor a recommendation to purchase or sell any securities. Nadia Simmons is not a Registered Securities Advisor. By reading Nadia Simmons’ reports you fully agree that he will not be held responsible or liable for any decisions you make regarding any information provided in these reports. Investing, trading and speculation in any financial markets may involve high risk of loss. Nadia Simmons, Sunshine Profits' employees and affiliates as well as members of their families may have a short or long position in any securities, including those mentioned in any of the reports or essays, and may make additional purchases and/or sales of those securities without notice.
© 2005-2022 http://www.MarketOracle.co.uk - The Market Oracle is a FREE Daily Financial Markets Analysis & Forecasting online publication.