


USD/JPY and EUR/JPY Testing Significant Hurdles
Currencies / Forex Trading Aug 01, 2018 - 03:42 PM GMTBy: FXOpen

 The weekly chart of USD/JPY and EUR/JPY indicates that both pairs are facing important resistance levels and they remain at a risk of a bearish reaction.
Key Points
- The US Dollar is trading above the 110.00 support and the 50-week simple moving average.
- USD/JPY is facing two significant bearish trend lines with resistance near 113.00 on the weekly chart.
- EUR/JPY declined recently and settled below a key support at 131.60.
- The pair remains at a risk of more losses towards the 128.00 and 127.00 supports.
USD/JPY Technical Analysis
The US Dollar formed a key support near the 104.60 level in March 2018 against the Japanese Yen. The USD/JPY pair climbed above the 106.00 and 108.00 resistance levels.
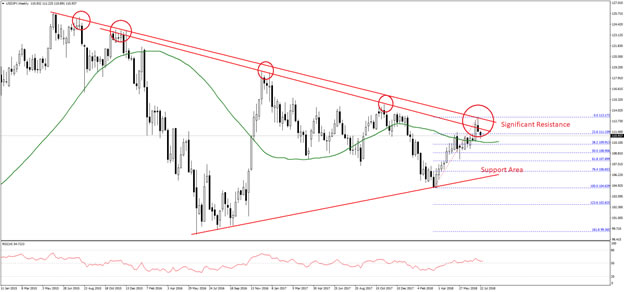
The pair also managed to move above the 110.00 resistance and the 50-week simple moving average. However, the upward move was capped by two significant bearish trend lines with current resistance near 113.00 on the weekly chart.
These trend lines prevented gains on many occasions during the past twelve months and they are currently stopping an upside break above 113.00.
The pair recently failed and dipped below the 23.6% Fib retracement level of the last wave from the 104.63 low to 113.17 high. On the positive note, the pair is still trading above the 50-week simple moving average and 110.00.
Should there be a break below the 50-week SMA, the pair could test the 50% Fib retracement level of the last wave from the 104.63 low to 113.17 high at 108.90. Below this, the pair will most likely drop towards a connecting bullish trend line on the same chart with support at 106.50.
On the flip side, if the pair breaks and settles above 113.00, it could open the doors for a larger uptrend. The next major resistances in the mentioned scenario are 115.00 and 116.50. Overall, the next move in USD/JPY depends whether the pair succeeds in clearing trend lines near 113.00.
EUR/JPY Technical Analysis
The Euro topped around the 137.50 level in January 2018 against the Japanese Yen. Later, the EUR/JPY pair declined and broke the 135.00 and 133.00 support levels.
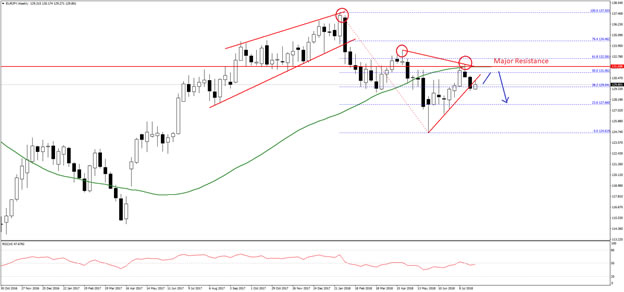
During the decline, there was a break below a key bullish trend line with support at 134.40 on the weekly chart. The pair even settled below the 50-week SMA and traded towards 125.00. A low was formed at 124.60 and later the pair staged a recovery.
During the past few weeks, the pair climbed and traded above the 128.00 and 130.00 resistance levels. There was also a break above the 38.2% Fib retracement level of the last drop from the 137.50 high to 124.61 low.
However, the upside move was capped by the previous support (now resistance) at 131.60 and the 50-week SMA. Moreover, the 50% Fib retracement level of the last drop from the 137.50 high to 124.61 low also acted as a hurdle for more gains.
The pair declined once again and broke a contracting triangle support at 130.40. If the stated break is real, there are chances of more slides in EUR/JPY below the 130.00 level. Below this, the pair may perhaps revisit the 128.00 support area.
On the other hand, if the pair recovers above 130.80, it could revisit the 131.60 resistance and the 50-week SMA. To recover and move into a bullish zone, the pair must close above the 132.00 barrier and the 50-week SMA. If not, it may well continue to decline towards 128.00 and 127.00.
The market outlook is provided by FXOpen broker.
FXOpen - true ECN/STP Forex and cryptocurrency broker.
© 2018 Copyright FXOpen - All Rights Reserved Disclaimer: The above is a matter of opinion provided for general information purposes only and is not intended as investment advice. Information and analysis above are derived from sources and utilising methods believed to be reliable, but we cannot accept responsibility for any losses you may incur as a result of this analysis. Individuals should consult with their personal financial advisors.
© 2005-2022 http://www.MarketOracle.co.uk - The Market Oracle is a FREE Daily Financial Markets Analysis & Forecasting online publication.