


A Depressed Economy And A Silver Boom
Commodities / Gold and Silver 2018 Aug 15, 2018 - 12:45 PM GMTBy: Hubert_Moolman

 Let’s take a look at silver priced in oil (WTI Crude), the Dow and US dollars:
Above, is silver priced in oil from 1983 to now. Price has moved in a large channel before it broke out at the end of 2014. This is really significant given the length of time involved.
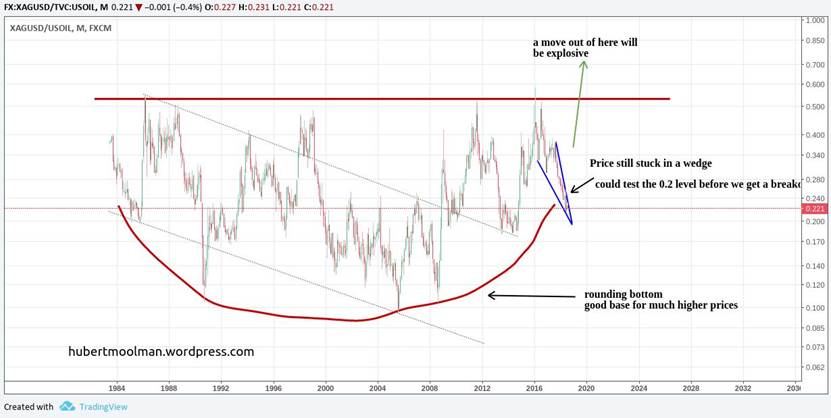
However, more importantly there is a massive rounded bottom which is a good base for the coming higher prices. At the end of the bottoming pattern there appears to be a bullish wedge.
Price is still stuck in the wedge, but it could be close to breakout. A breakout at the top line of the giant cup is the sign of a depressed economy.
Just like for oil, the relationship between silver and the Dow is an important measure of economic conditions.
Here is a chart of silver priced in the Dow:
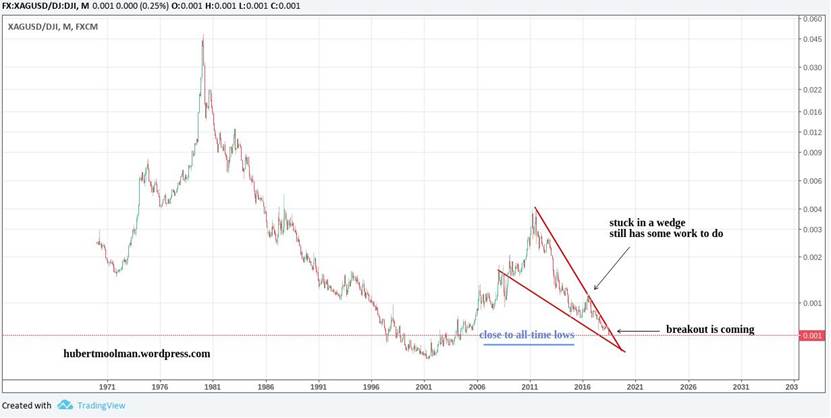
Currently silver priced in the Dow is close to all-time lows. Economic conditions is favourable to paper and debt-based assets. The bullish wedge is an indication that all this is about to change.
A breakout from the wedge will be the start of a massive wave of economic depressed conditions. The rally should be larger and more intense than the one from 2001 to 2011.
The most popular silver price (US dollar silver price) is currently completing a bottoming process similar to that of 2001 to 2003:
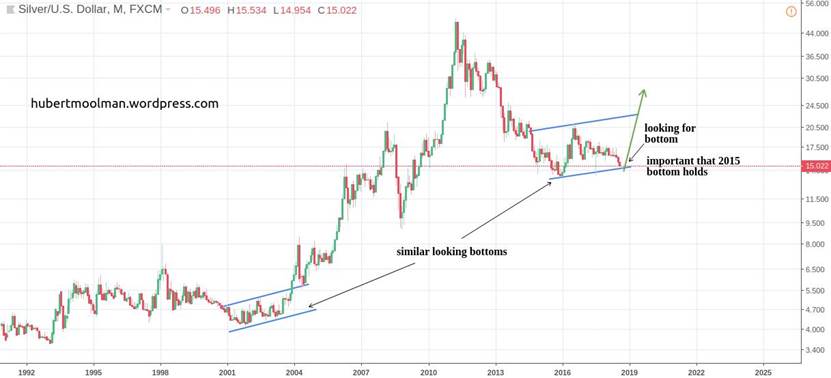
The current bottoming pattern looks like triangle that broke down. However, it actually is very bullish although it still needs to find a bottom. The bearish look of the triangle is creating that perfect panic that is needed before price can go higher.
The wise is buying right now while the fearful are selling. It only is important that price does not go lower than the low of 2015.
For more on this and this kind of fractal analysis, you are welcome to subscribe to my premium service. I have also recently completed a Silver Fractal Analysis Report as well as a Gold Fractal Analysis Report. You can also subscribe to this blog (enter email at the top right of this page) to get my latest free gold and silver updates.
Warm regards,
Hubert
“And it shall come to pass, that whosoever shall call on the name of the Lord shall be saved”
http://hubertmoolman.wordpress.com/
You can email any comments to hubert@hgmandassociates.co.za
© 2018 Copyright Hubert Moolman - All Rights Reserved
Disclaimer: The above is a matter of opinion provided for general information purposes only and is not intended as investment advice. Information and analysis above are derived from sources and utilising methods believed to be reliable, but we cannot accept responsibility for any losses you may incur as a result of this analysis. Individuals should consult with their personal financial advisors.
© 2005-2022 http://www.MarketOracle.co.uk - The Market Oracle is a FREE Daily Financial Markets Analysis & Forecasting online publication.