Financial Markets Fear and Uncertainty Remain After AIG Bailout
Stock-Markets / Credit Crisis 2008 Sep 17, 2008 - 09:13 AM GMTBy: Chris_Ciovacco

 "The U.S. government seized control of American International Group Inc. -- one of the world's biggest insurers -- in an $85 billion deal that signaled the intensity of its concerns about the danger a collapse could pose to the financial system. The step marks a dramatic turnabout for the federal government, which had been strongly resisting overtures from AIG for an emergency loan or some intervention that would prevent the insurer from falling into bankruptcy. Just last weekend, the government essentially pulled the plug on Lehman Brothers Holdings Inc., allowing the big investment bank to go under instead of giving it financial support." Wall Street Journal, 9/16/2008
The Feds have once again taken unprecedented steps to assist/takeover a public company just as we were on the cusp of more dramatic selling of stocks. A few very early observations:
- After falling 600 points (4.95%) on Tuesday, stocks in Japan were up over 250 points in the first two hours of trading today. After the initial surge, the gains have fallen back to a gain of 140 points.
- U.S. stock futures were down this morning indicating a fearful response to the AIG bailout.
- The Fed's loan to AIG carries a two-year term, which means more losses are expected over the next 12 to 24 months. The Fed's bailout is not simply a short-term loan to help AIG get through a temporary liquidity shortage.
- If AIG ran into problems, there are other companies who most likely have similar problems. The markets are in "who's next?" mode, which could result in wild swings on bad news, especially bad news from financial firms.
Markets May Be Approaching A Temporary Bottom
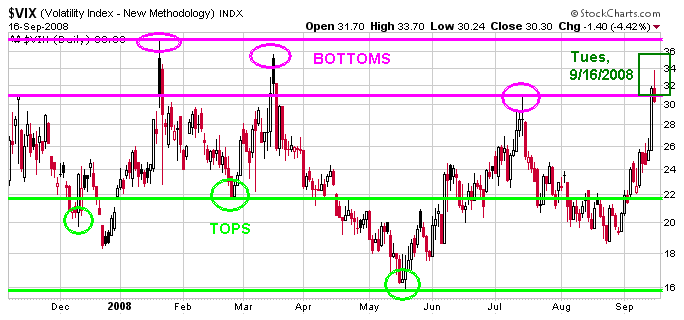
The two charts below say we may be approaching an intermediate bottom. The chart of the Volatility Index (a.k.a the VIX) is a way to measure market participants' fear of potential losses. Markets tend to make bottoms or reverse trend when fear levels are high. Conversely, markets tend to top or peak when people are confident more gains lie ahead. The green circles show the last three market tops in 2008 (a low reading on the VIX). The pink circles show the bottoms made in 2008 (a high reading on the VIX). The dark green box shows the VIX as of Tuesday's close. A VIX reading in the mid 30s is more indicative of an intermediate (temporary) bottom rather than a bottom which would put an end to a bear market.

The VIX peaked in the mid 40s in 2002, so there is room for significantly more downside in stocks. Yesterday's high on the VIX was roughly 34. The VIX frequently had readings above 34 between July 10, 2002 and October 24, 2002. The S&P 500 fell 19.6% from July 10, 2002 to the eventual bear market bottom on October 9, 2002, which shows a reading of 34 on the VIX probably does not signal an end of the bear market. However, a reading of 34 on the VIX can signal we may be approaching a multi-week rally in stocks.
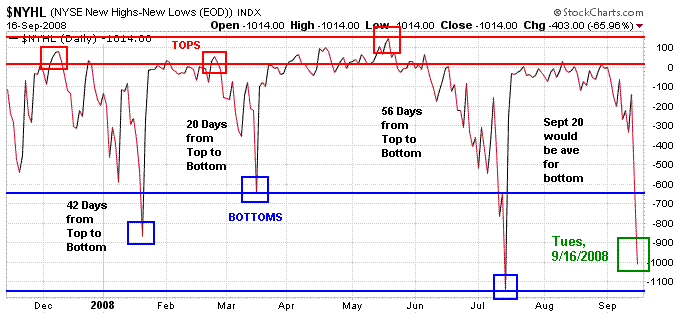
When a significant number of stocks are making new highs on an exchange, it is bullish. When there are significantly more stocks making new lows then new highs it is indicative of a weak market. When the number of new lows versus new highs gets to more extreme levels, it can signal selling exhaustion or investors "throwing in the towel". The chart below shows the number of new highs minus the number of new lows made on the NYSE. Market tops made in 2008 are shown in the red boxes. Market bottoms made in 2008 are shown in the blue boxes. The reading as of Tuesday's close is shown in the dark green box. During the last bear market, the lowest reading was -907, which occurred on July 24, 2002. After the reading of -907, stocks staged a powerful bear market rally gaining 24% from the July 24, 2002 lows. The 2002 rally lasted four weeks. Tuesday's reading was a -1,014 indicating a strong desire to sell stocks.

These indicators should not be used in isolation. The VIX could move higher and the NYSE New Highs - New Lows could move lower. However, the indicators and the government's announcement concerning AIG should not be ignored. The best chance for a somewhat permanent bottom in stocks would be for it to occur after another round of strong selling. If new developments support some type of bottom, then defensive positions would become less attractive and growth investments would become more attractive. We are not there yet, but we appear to be moving closer. These indicators do not necessarily point to "the bottom", but they do point toward a possible change in the intermediate trend occurring relatively soon. Any negative news could trigger more declines in a fragile market.
A 23% Decline Makes Valuations More Attractive
The S&P 500 fell 23% from its intraday high made on October 11, 2007 to intraday low made on Tuesday, September 16, 2008. We have entered a range in stock prices where valuations are beginning to look somewhat attractive (less overvalued). Just like the technical indicators above, valuations should not be used in isolation. Cheap stocks can get cheaper.
Risks remain at elevated levels and the economy still faces serious obstacles on the housing, banking, and employment fronts. Therefore, any stock rallies should be met with a prudent dose of skepticism. If the markets rally on Wednesday (or in the coming days), it will be important to see how they act in the last hour of trading. A strong finish Wednesday would be a good sign. A weak finish may indicate the market feels more problems lie ahead, which is most likely the case. A heavy cash position remains prudent for the time being.
By Chris Ciovacco
Ciovacco Capital Management
Copyright (C) 2008 Ciovacco Capital Management, LLC All Rights Reserved.
Chris Ciovacco is the Chief Investment Officer for Ciovacco Capital Management, LLC. More on the web at www.ciovaccocapital.com
Ciovacco Capital Management, LLC is an independent money management firm based in Atlanta, Georgia. As a registered investment advisor, CCM helps individual investors, large & small; achieve improved investment results via independent research and globally diversified investment portfolios. Since we are a fee-based firm, our only objective is to help you protect and grow your assets. Our long-term, theme-oriented, buy-and-hold approach allows for portfolio rebalancing from time to time to adjust to new opportunities or changing market conditions. When looking at money managers in Atlanta, take a hard look at CCM.
All material presented herein is believed to be reliable but we cannot attest to its accuracy. Investment recommendations may change and readers are urged to check with their investment counselors and tax advisors before making any investment decisions. Opinions expressed in these reports may change without prior notice. This memorandum is based on information available to the public. No representation is made that it is accurate or complete. This memorandum is not an offer to buy or sell or a solicitation of an offer to buy or sell the securities mentioned. The investments discussed or recommended in this report may be unsuitable for investors depending on their specific investment objectives and financial position. Past performance is not necessarily a guide to future performance. The price or value of the investments to which this report relates, either directly or indirectly, may fall or rise against the interest of investors. All prices and yields contained in this report are subject to change without notice. This information is based on hypothetical assumptions and is intended for illustrative purposes only. THERE ARE NO WARRANTIES, EXPRESSED OR IMPLIED, AS TO ACCURACY, COMPLETENESS, OR RESULTS OBTAINED FROM ANY INFORMATION CONTAINED IN THIS ARTICLE. PAST PERFORMANCE DOES NOT GUARANTEE FUTURE RESULTS.
Chris Ciovacco Archive |
© 2005-2022 http://www.MarketOracle.co.uk - The Market Oracle is a FREE Daily Financial Markets Analysis & Forecasting online publication.


