


USD’s Weekly Breakout and the Gold Golden Spring
Commodities / Gold and Silver 2018 Nov 07, 2018 - 03:44 PM GMTBy: P_Radomski_CFA

 USDX’s Friday’s close was its highest weekly closing prices of 2018. This is an extremely significant confirmation of the bullish outlook for the US currency that followed the verification of the breakout above the inverse head-and-shoulders pattern. The implications are clearly bullish for the US dollar. But are they clearly bearish for gold? The yellow metal ended the week close to its October lows and the SLV ETF closed at the highest level since late August. Is the outlook for the precious metals market really bearish?
Yes, it is. Precious metals’ reaction to the action in the USD could be delayed at times and it's most likely the case also this time. The current times are far from being calm due to the recent volatility on the stock market and because we are just before US elections. Consequently, it’s not that odd to see gold and silver hold up relatively well despite the build-up in the bearish implications from many long-term charts and from the USD Index.
Precious metals’ performance is like a coiled spring. Once the tensions regarding the stock market and elections are gone (or they diminish in a meaningful way – for instance the business can be back to normal after the elections), gold, silver, and mining stocks are likely to catch up with their signals and decline in a very profound way.
And we have short-term confirmations that this is likely the case.
Relative Valuations
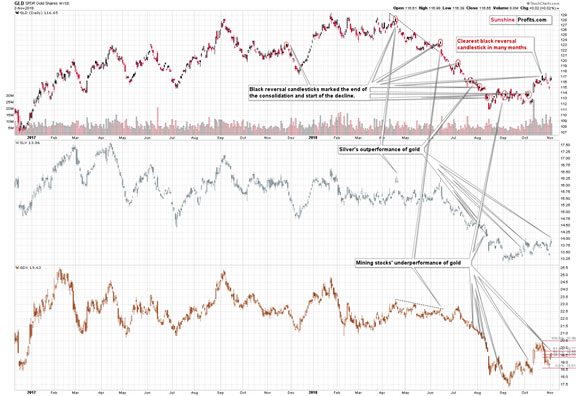
One of the most useful gold trading tips in general is the short-term relative performance of silver and mining stocks relative to gold. Local tops are very often accompanied by underperforming miners and outperforming silver. That’s exactly what we saw in the final part of the previous week.
The SLV ETF closed the day above the previous recent daily closing prices, while the GLD ETF didn’t. The GDX ETF (proxy for miners) was only a big above the 50% retracement from the recent highs. Miners underperformed, while silver outperformed, and the implications are bearish.
SLV’s breakout in terms of the closing prices is an interesting sign on its own as silver is known for its fake breakouts. If silver is breaking above a certain level, but gold and mining stocks are not confirming this sign, the silver breakout is likely a fake one and it’s likely to be followed by an invalidation and – quite likely – a sharp decline.
It’s worth keeping in mind that silver’s breakout is only a very short-term phenomenon.
Silver’s and Gold’s Long-term Signals
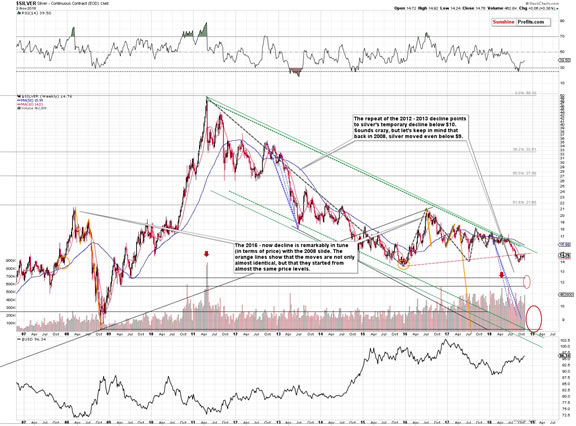
From the broad perspective, it’s clear that the white metal remains below the previously broken rising long-term support / resistance line. It’s currently at about $15, so even a move to this level would not change anything from the technical point of view.
The breakdown below this important line and its confirmation makes the move lower very likely. The 2015 lows are quite close to the current price, so it’s unlikely that they will be able to stop the decline. After all, the size of the move that follows a consolidation is likely to be similar to the size of the preceding move. The preceding decline took silver more than $3 lower, so it’s quite likely that we’ll get a slide to about $11 - $12.50 area instead of a one that ends at the 2015 bottom.
As a reminder, that’s not where we expect the decline to end. We may (and are likely to) get a bounce from these levels (perhaps the 2015 bottom will be verified as resistance as silver moves back to it) and then a final decline to the true bottom at extremely scary price levels – quite likely at or below $10.
Gold’s long-term chart can also tell us something interesting.
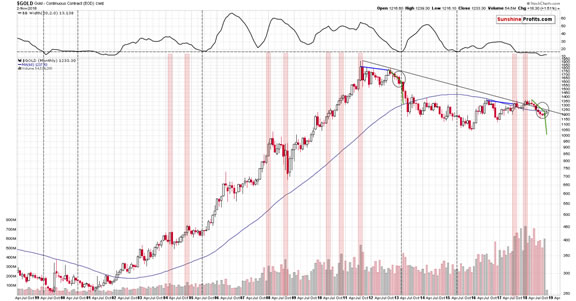
Last week we emphasized how similar the situation in gold is to what happened in 2013 and in today’s analysis we’ll revisit this issue, while looking at monthly price changes.
There was only one monthly upswing in gold during the huge 2012 – 2013 decline. There was also only one monthly upswing (March 2013) in case of the decline that started in the first half of this year. And it was last month. This suggests that we are quite likely just before the biggest and most volatile part of the decline. It’s not the time to put one’s guard down. It’s the time to be extremely alert and positioned accordingly.
Gold is higher this month, but this doesn’t invalidate anything. In April 2013, right before the decline, we first saw a move higher that took the yellow metal above the previous month’s (March) closing price, but not above its intraday high. October’s closing price was $1,215, and its intraday high was $1,246. Gold is currently trading around the $1,230 price level – in perfect tune with how high it moved in April 2013, just days before the big plunge.
The 2013 – now link remains intact; and the bearish gold price forecast appears to be well justified.
Let’s take a moment to review the performance of the USD Index.
USDX’s Confirmed Breakouts
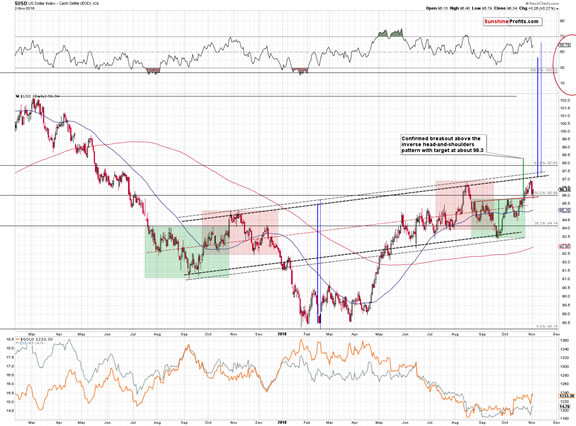
The breakout above the inverse head-and-shoulders pattern was confirmed by many daily closes, weekly and monthly closes, and a move back to it that was followed by a rally. In other words, it was confirmed by practically all possible ways. It’s also in tune with the long-term bullish analogy, and this strength took place while Trump openly criticized Fed, which should have caused the value of the US currency to decline. And it rallied instead. It’s really hard to imagine a more powerful bullish combination of factors.
Ok, if (which – based on the above – is more of a “when” issue than “if”) we get a confirmed breakout above the medium-term inverse head-and-shoulders, the implications for the following weeks will be even more bullish, but as far as short-term is concerned, we have it all.
Why is this so important for the precious metals market. The obvious reason is that because of the long-term negative link between gold and the USDX, rallying USD is likely to translate to declining gold prices sooner or later. But, there’s also a less clear reason that is just as important from the analytical point of view.
If the USD Index is going to rally in the following weeks and we are wrong about the medium-term outlook for gold, silver, and mining stocks, then it means that we will likely not see soaring PMs anyway, but rather a continuation of the sideways trading pattern. This would give us a lot of time to adjust our positions and perhaps to get in the precious metals market with the long-term investment capital. While it doesn’t directly affect the portfolio, it creates an “analytical safety net” as it’s likely that we would get very clear “change your mind already!” signals from the gold-USDX link. At this time, this signal is not present due to the reasons that we outlined earlier. Namely, gold, silver, and mining stocks are likely kept up due to the increased (but temporary) level of uncertainty and tensions regarding the general stock market’s performance and the US elections. Once the business is back to normal, gold will likely catch up with its long-term indications and decline in a meaningful way.
This completes the short-term part of the analysis, but it doesn’t complete the entire essay just yet. Before summarizing, we would like to update you on the triangle-vertex-based reversals for the entire precious metals sector.
Gold’s, Silver’s, and Mining Stocks’ Reversal Dates
Let’s start with discussion of the reversals in gold.
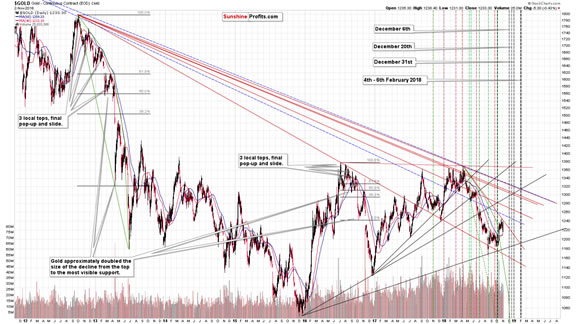
In March, 2018, we featured the triangle-apex-based (a.k.a. triangle-vertex-based) reversals and it turned out that practically all the turning points marked with this technique worked in one way or another. Sometimes, the tops were important and sometimes they were very brief. But in practically all cases, the technique was useful. The vertical lines that are from the recent past were black as their implications were unclear in the past and – without moving them - we just changed their color depending on what implications they had. Please take a moment to check how well this technique worked. The consequence is that we will attribute even greater weight to these gold signals in the future.
However, the main reason that we mention the above is that we updated the calculations based on the most recent price extremes and that the outlook itself changed a bit as the current decline takes longer than we had originally expected it to take. When the underlying facts change, the analysis should be adjusted based on them, so that it’s always up-to-date. Basing one’s outlook and trading positions on previous signals that are no longer in place (for instance holding on to a long position in the precious metals sector because of the inverse head-and-shoulders in the mining stocks that was already invalidated) is one of the ways to lose capital over time. Staying objective and up-to-date is a way to grow it.
Moving back to the point, we have four triangle-based reversals ahead. The first one is on December 6th, the second one on December 20th, third one on December 31st, and the final one between February 4th and 6th.
The reason for two dates in case of the latter is that it’s actually based on three separate triangles. One of them is based on the December 2015 and August 2018 bottoms, and the April 2018 and October 2018 tops. The remaining two ones are of long-term nature. They are based on the rising line that’s based on the December 2015 and December 2016 bottom and the declining long-term lines that are (both) based on the April 2018 high, the late-2012 high and the 2011 high.
The last time we saw a reversal that was based on more than one triangle was the early October bottom and it was indeed followed by a sharp rally. This makes it even more likely that the early February 2019 reversal will be a very important reversal. Perhaps it will be THE final bottom for the current decline – with gold at about $890.
If so, then the previous 3 reversals might correspond to the initial bounce (move to the $1,050 level or so in gold in early December) and the end of the corrective upswing close to the end of the month (either close to 20th or 31st).
Naturally, the above is the possible gold’s performance that seems likely based on the information that we have available right now. Once more details become available, we will adjust our analysis accordingly.
Let’s see how the above fits the reversal dates for silver.
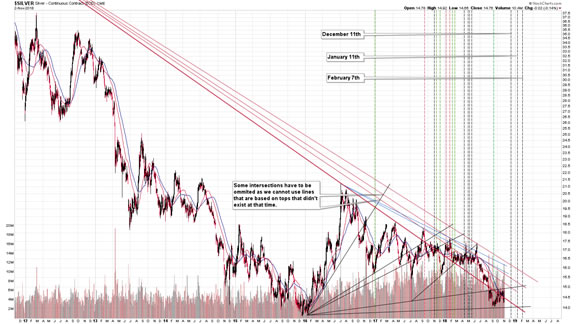
In short, it fits them very well. The first of the upcoming reversal dates is on December 11th, the second is on January 11th, and the third is on February 7th.
The lines that cross at the above dates are different than those that we see in gold, so the fact that the reversal dates in silver are similar to the ones in gold is quite astonishing. The similarity is not perfect in case of the December and January reversals, but it is clearly present in case of the February one.
Taking both charts into account and their own implications, we get a situation, in which the precious metals market is likely to reverse initially close to the middle of December 2018 and then once again in early January. Both are not very precise, though, and additional signs should be considered before adjusting one’s position. The key take-away is that a major reversal is likely to take place in the first half of February, 2019. This target is confirmed not only by three triangle-vertex-based reversals in gold, but also by one in silver.
What about the miners?
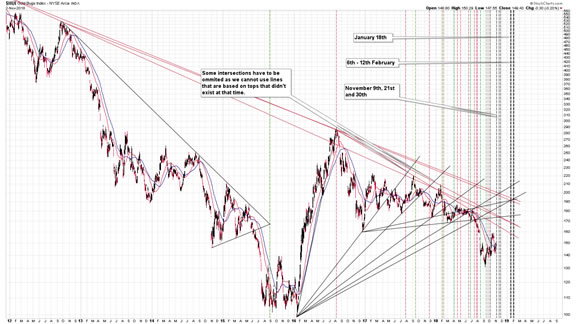
There are several reversals that are just around the corner and the nearest is this Friday and then there are two close to the end of November (21st and 30th). There is only one similar case in the recent past, when we saw similar amount of reversal dates in a relatively short period. It’s July and early August and that’s when miners declined in a profound way.
In addition to this month’s reversal dates, we have only two nearby reversal dates based on the triangles’ vertexes, and they are both based on more than one vertex. They are based on two declining red resistance lines and two rising support lines (one starts at the early 2016 bottom and the other starts at the late-2016 bottom).
The first strong reversal is on January 18th and the second is between February 6th and 12th (the two vertexes are not in perfect tune, but close enough to be taken into account together).
The reversal prediction for January gets blurrier based on the above as the one from gold points to a reversal either at the end of 2018 or in the first session of 2019, silver points to a reversal on January 11th, and miners vertex suggest a turnaround on 18th. It could be the case that different parts of the PM market reverse at different times, or it could be the case that we will have a very volatile market in January with several reversals. At this time it’s impossible to say which of the above is more likely.
The most profound implication of the above chart, however, is the fact that we get a reversal prediction in the first half of February, 2019. It’s between February 6th and February 12th, so it perfectly fits the dates that we get based on gold’s and silver’s charts.
Consequently, the most important and strongest indication that we get from all three of the above charts, is that the precious metals sector is very likely to reverse in early February 2019. Based on the shape of gold’s decline in 2013 and the analogy to the current decline, the first half of February is currently the most likely time target for THE final bottom in gold and the rest of the precious metals sector.
Summary
Summing up, the outlook remains strongly bearish for the precious metals sector and the fact that PMs are not yet responding to USD’s strength doesn’t invalidate it. The current back and forth trading is tiring, and/or boring depending on one’s perspective (tiring from the short-term one, and boring from the long-term one), but it’s very likely that the patience here will be well rewarded. Silver’s outperformance and miners’ underperformance suggests that we will likely not have to wait much longer.
To be clear, gold is still likely to rally to $6,000 or so, but not before declining significantly first.
On a side note, before calling us perma-bears, please note that we were bullish (in terms of long-term investments) on precious metals for years – until April 2013. We’re looking for the true bottom in the precious metals sector, not because we’re its or gold investors’ enemy. Conversely, we’re that true friend that tells you if something’s not right, even if it may be unpleasant to hear.
Naturally, the above is up-to-date at the moment of publishing it and the situation may – and is likely to – change in the future. If you’d like to receive follow-ups to the above analysis (including the intraday ones, when things get hot), we invite you subscribe to our Gold & Silver Trading Alerts today.
Thank you.
Przemyslaw Radomski, CFA
Founder, Editor-in-chief
Tools for Effective Gold & Silver Investments - SunshineProfits.com
Tools für Effektives Gold- und Silber-Investment - SunshineProfits.DE
* * * * *
About Sunshine Profits
Sunshine Profits enables anyone to forecast market changes with a level of accuracy that was once only available to closed-door institutions. It provides free trial access to its best investment tools (including lists of best gold stocks and best silver stocks), proprietary gold & silver indicators, buy & sell signals, weekly newsletter, and more. Seeing is believing.
Disclaimer
All essays, research and information found above represent analyses and opinions of Przemyslaw Radomski, CFA and Sunshine Profits' associates only. As such, it may prove wrong and be a subject to change without notice. Opinions and analyses were based on data available to authors of respective essays at the time of writing. Although the information provided above is based on careful research and sources that are believed to be accurate, Przemyslaw Radomski, CFA and his associates do not guarantee the accuracy or thoroughness of the data or information reported. The opinions published above are neither an offer nor a recommendation to purchase or sell any securities. Mr. Radomski is not a Registered Securities Advisor. By reading Przemyslaw Radomski's, CFA reports you fully agree that he will not be held responsible or liable for any decisions you make regarding any information provided in these reports. Investing, trading and speculation in any financial markets may involve high risk of loss. Przemyslaw Radomski, CFA, Sunshine Profits' employees and affiliates as well as members of their families may have a short or long position in any securities, including those mentioned in any of the reports or essays, and may make additional purchases and/or sales of those securities without notice.
Przemyslaw Radomski Archive |
© 2005-2022 http://www.MarketOracle.co.uk - The Market Oracle is a FREE Daily Financial Markets Analysis & Forecasting online publication.