


China Stock Market Preparing New Elliott Wave Bullish Cycle
Stock-Markets / Chinese Stock Market Nov 22, 2018 - 04:48 PM GMT

 The trade war between USA & China had led to a global fear around the stock market and causing a mid-term “bear market” in China which lost 30% since the start of 2018. The latest plan is that the two leaders US President Donald Trump and Xi Jinping would meet for dinner on December 1 immediately after the G20 meeting in the Argentine capital Buenos Aires.
Trump says US is ‘doing extremely well’ with China but deal not done yet. Therefore the next meeting could be critical for this ongoing war trade talk and its result will have important effect around the market.
At ElliottWave Forecast, we believe the market is ruled by technical aspect and the news is an after-fact event to drive the market into the pre-determined direction. Therefore, understanding the Nature of the Market is key for traders to stay in the right side and follow a clear path which have nothing to do with Fundamentals or events.
For our technical explanation, we’ll be using the largest China ETF “iShares China Large-Cap ETF FXI” which tracks an index of the 50 largest and most liquid Chinese stocks traded on the Hong Kong Stock Exchange.
China Large-Cap ETF FXI Monthly Chart
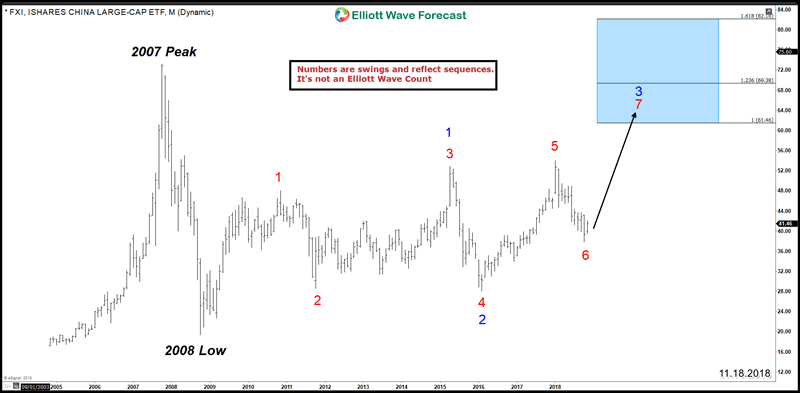
Since 2008 low, we can count 5 swings sequence (Red Color) to the upside until the recent 2018 peak which isn’t an Elliott Wave count but a representation of the sequence. In this case, FXI has an incomplete bullish sequence and ideally after ending the 6th swing it will be heading higher in the 7th swings toward equal legs area $61.46 – $69.38. There, the ETF can be ending a larger 3 swings (Blue color) followed by 3 waves pullback.
After clarifying the bigger picture for FXI, we can switch to the daily time frame to understand the current structure:
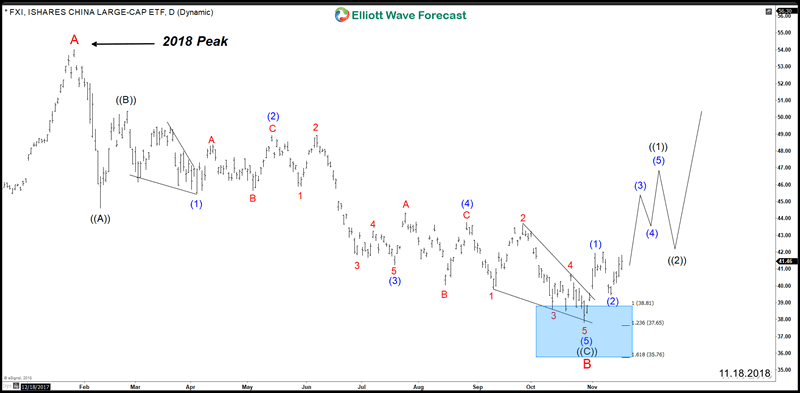
From January 2018 peak, FXI declined in a 3 waves Zigzag structure and reached the extreme blue box area $38.8 – $35.76 which is a High-frequency area where the markets are likely to end cycles and make a turn. Up from there, the ETF is looking to resume the rally higher in an impulsive 5 waves structure or at least it will bounce in 3 waves to correct 2018 decline.
Consequently, China’s stock market will rally and drive the rest of global market with it in the coming few weeks based on the Monthly bullish sequence and the current daily structure. So deal or no deal between USA & China the result will be the same in favor of the Bulls.
Get our latest updates for World Indices like SPX , DAX and NIKKEI by using our Black Friday promotion: 50% Off All Monthly Plans to learn how to trade our blue boxes using the 3, 7 or 11 swings sequence. You will get access to our 78 instruments updated in 4 different time frames, Live Trading & Analysis Session done by our Expert Analysts every day, 24-hour chat room support and much more.
By Ayoub Ben Rejeb
https://elliottwave-forecast.com
ElliottWave-Forecast has built its reputation on accurate technical analysis and a winning attitude. By successfully incorporating the Elliott Wave Theory with Market Correlation, Cycles, Proprietary Pivot System, we provide precise forecasts with up-to-date analysis for 52 instruments including Forex majors & crosses, Commodities and a number of Equity Indices from around the World. Our clients also have immediate access to our proprietary Actionable Trade Setups, Market Overview, 1 Hour, 4 Hour, Daily & Weekly Wave Counts. Weekend Webinar, Live Screen Sharing Sessions, Daily Technical Videos, Elliott Wave Setup .
Copyright © 2018 ElliottWave-Forecast - All Rights Reserved Disclaimer: The above is a matter of opinion provided for general information purposes only and is not intended as investment advice. Information and analysis above are derived from sources and utilising methods believed to be reliable, but we cannot accept responsibility for any losses you may incur as a result of this analysis. Individuals should consult with their personal financial advisors.
© 2005-2022 http://www.MarketOracle.co.uk - The Market Oracle is a FREE Daily Financial Markets Analysis & Forecasting online publication.