


Is there a Lump of Coal in Santa's Stock Market Bag?
Stock-Markets / Financial Markets 2018 Dec 16, 2018 - 04:04 PM GMT

 VIX eased down to challenge the weekly short-term support at 20.48 on Thursday. On Friday it bounced to close above its Cycle Top support/resistance at 21.25. Wall Street doesn’t seem to be alarmed.
(Bloomberg) Wall Street is making peace with the new normal of higher volatility as stocks careen between agonizing sell-offs and sudden rallies.
After the gut-wrenching $2.5 trillion wipeout in the S&P 500 since early October, traders are resting at relative ease as they prep for market bumps down the road.
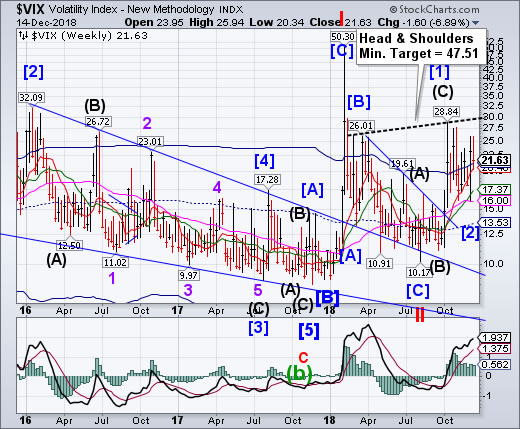
A measure of expected changes in the Cboe Volatility Index is sitting near its lowest level since 2016 versus the underlying fear gauge, while demand to hedge tail risks is at multi-year lows.
SPX bounced at the neckline, round trips back to were it started.
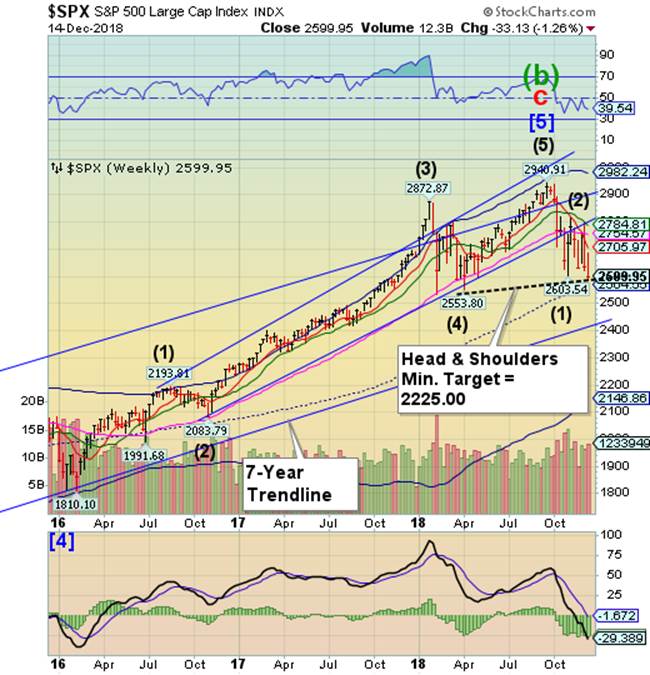
SPX challenged the Head & Shoulders neckline at 2583.23 on Monday, then made a near-50% retracement before losing nearly all of its gains at the close of the week. The sentiment that this action is only a test of the low is fading fast. The Cycles Model still holds out for another week or more of decline.
(Bloomberg) U.S. stocks closed at their lowest level since April, with Treasuries rising alongside the yen, as mounting concern over the health of the global economy overshadowed positive trade developments and signs of strength from the American consumer.
The S&P 500 Index tumbled 1.9 percent Friday, after testing February lows, erasing the week’s gains. Health-care and technology stocks were among the biggest decliners. The Dow Jones Industrial Average sank almost 500 points, led by Johnson & Johnson’s biggest rout in years amid mounting legal peril. Retailers retreated even after monthly data indicated U.S. consumers are still spending. Oil and gold fell.
NDX is repelled at Short-term resistance as bounces become weaker.
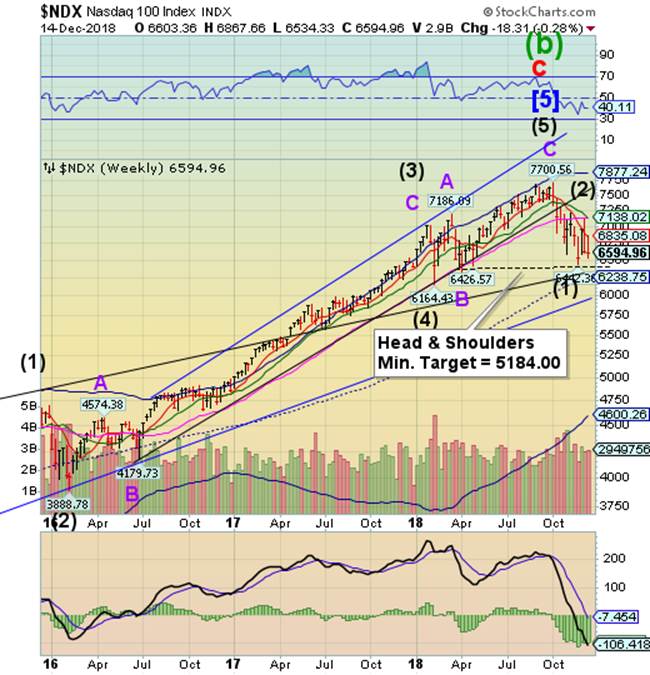
NDX attempted a rally to Short-term resistance at 6835.08, but couldn’t hold its gains. The Cycles Model suggests weakness may extend for at least another week with potentially devastating results. The Head & Shoulders neckline is in striking distance, which may accelerate the decline. The Long-term (7-year) trendline is at 6000.00.
(CNN) Earlier this year, tech stocks were on fire. Now many are struggling, and their prospects don't seem to be getting any better.
Tech has been rattled by the escalating trade war between the United States and China. Relations between the two countries could turn even more sour after Chinese tech giant Huawei's chief financial officer was detained in Canada.
Meng Wanzhou's arrest at the request of the United States sent shock waves through global stock markets last week. Chinese tech stocks were among the hardest hit.
Meanwhile, a Chinese court banned the sale and import of most iPhone models. The practical effect of the injunction is not yet clear. The ruling was announced publicly Monday but put into effect last week. Apple (AAPL) said in a statement that all iPhone models remain available in China.
High Yield Bond Index reverses most of its gains.
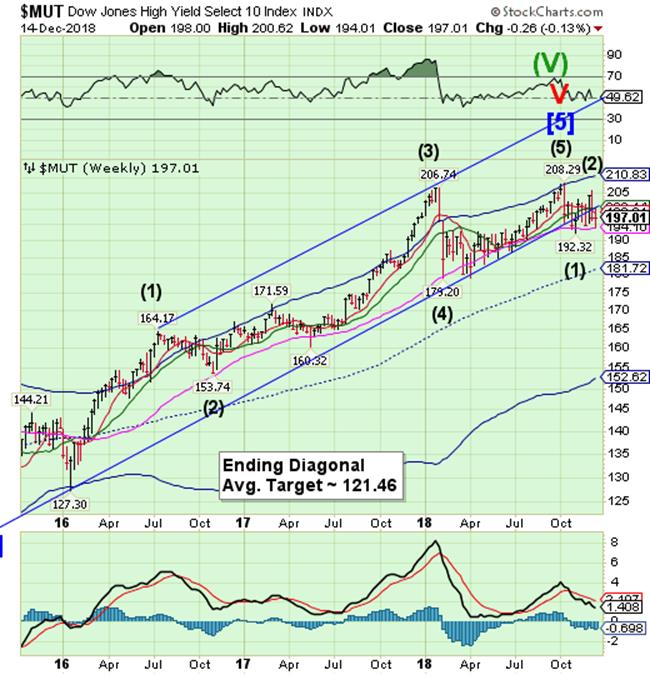
The High Yield Bond Index made a new low on Monday, then rallied back up to the Long-term trendline at 200.14. However, it could not keep those gains, ending the week at a loss. It is on a sell signal, but confirmation may be found beneath Long-term support at 194.10.
(ZeroHedge) While the market's frenzied attention has lately shifted to the cracks appearing in the leveraged loan market, which as we reported last night is seeing the "wheels come off" following record outflows, a collapse in loan prices, massive original issue discounts, pulled deals, banks retaining loans on their books unable to find buyers and a general sense that the market is about to freeze, one should not forget the original bogeyman that many believe will be the cause of the next credit crisis when the upcoming recession finally hits: a wholesale downgrade of investment grade (or BBB) rated companies into the junk space as rating agencies finally wake up to the reality of what the combustible mix of record debt, declining cash flows and a contracting economy mean for US corporations.
And it is here that things are once again moving from bad to worse.
UST consolidates near the high.
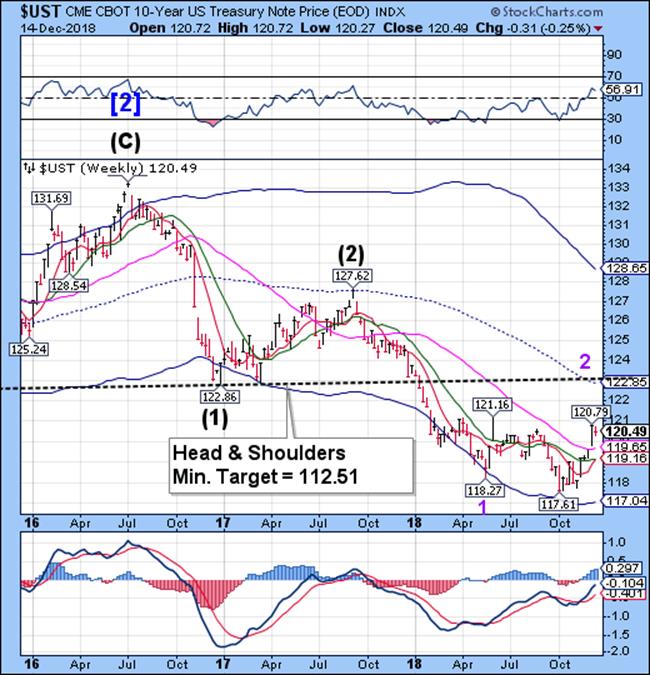
The 10-year Treasury Note Index consolidated its gains this week, preparing for another probe higher. UST may extend its rally into late December and may reach mid-term resistance at 122.85, according to the Cycles Model.
(HowStuffWorks) Economic speculation can often feel like a self-fulfilling prophecy. When confidence in the economic future is high, the markets and the broader economy hum along. But when investors, banks and business get nervous, money stops flowing and the whole system grinds to a halt. That's called a recession.
The United States economy has been riding the longest bull market in history, posting record stock market gains and historically low unemployment figures. But the fact is, recessions happen and it's been nearly 10 years since the last one officially ended. While we're not technically "due" for another market correction, it's starting to feel that way for some investors. GM recently announced big layoffs and the trade war with China shows no sign of ending soon.
The Euro at the low end of its trading range.
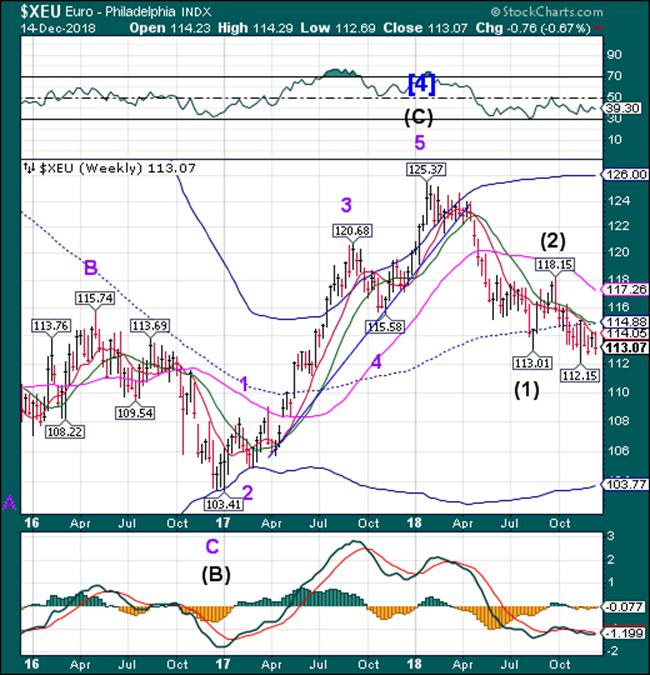
The Euro appears to be losing its grip on the month-long trading range. It continues on a sell signal after an attempt to overcome Short-term resistance at 114.05 was rebuffed. The Cycles Model suggests a probable continuation of weakness through the end of December.
(Express) Economists in the European Union are scrambling to fix an impending economic meltdown following a shock plunge in Germany and France. The two leading EU countries suffered a dramatic economic slump after a business survey of the two countries was released. Emmanuel Macron and Angela Merkel were hit by weaker than expected figures, with fears that the two so-called "engines of Europe" could in fact drag down the bloc.
France and Germany dragged down eurozone growth as the weaker-than-expected data caused the euro to plummet in value against the US dollar and GB pound.
It was the eurozone's weakest quarter of growth since early 2013.
According to the figures frmo IHS Markit, France's private sector has "ground to a halt".
EuroStoxx declines beneath the Cycle Bottom.
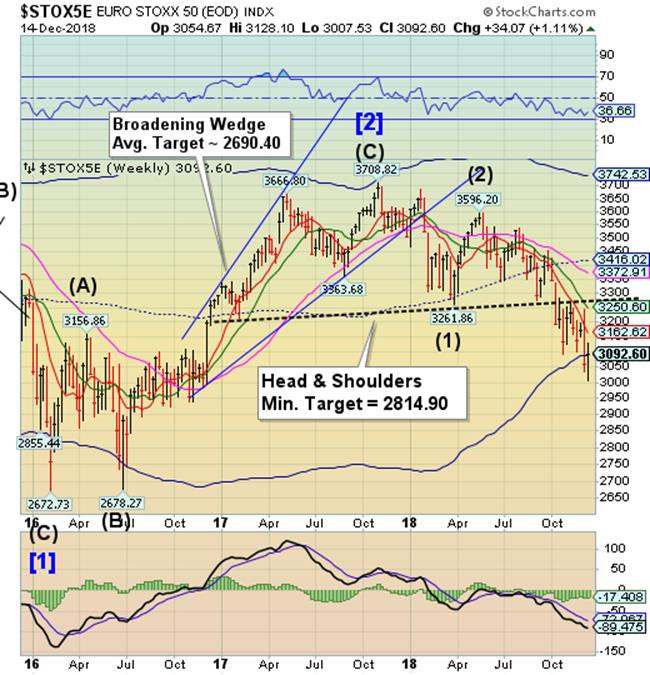
The EuroStoxx may have made a Master Cycle low on Monday at 3007.53. However, the decline has not met any of its targets. The Cycles Model may allow for an extension of the Cycle for yet another week or so.
(CNBC) European stocks closed lower Friday as weaker-than-expected economic data heightened concerns of a slowdown in global economic growth.
The pan-European Stoxx 600 closed provisionally down 0.63 percent, with almost all sectors and major bourses in negative territory.
Market focus is largely attuned to a possible economic slowdown over the coming months. It comes after China reported weaker-than-expected retail sales data on Friday. The sector grew at its weakest pace since 2003 in November, with disappointing industrial and domestic demand figures also darkening the Asian giant's economic outlook. Meanwhile, European data also disappointed, with the IHS Markit Flash Eurozone PMI index falling to 51.7 in December, its lowest level in four years.
.The Yen repelled at Intermediate-term resistance.
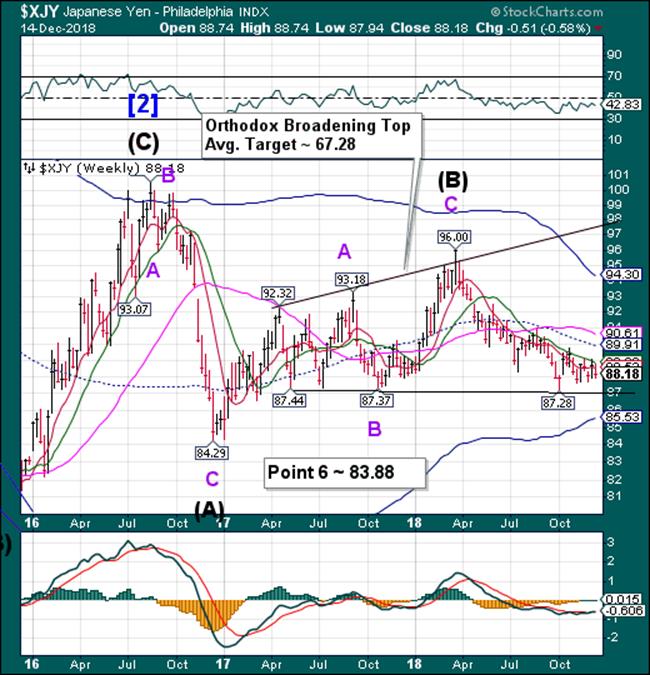
The Yen continues to be repelled at Intermediate-term resistance at 88.83, showing continued weakness. An apparent inverted Cycle high may have been made last week, allowing for continued weakness through the end of the month. There seems to be no consensus on the Yen in the media.
Nikkei declines toward the neckline.
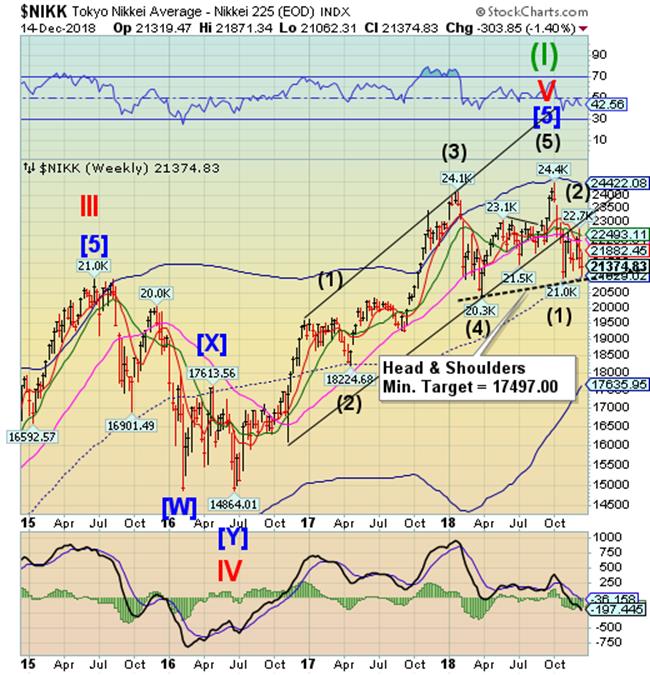
The Nikkei bounced off the Head & Shoulders neckline on Tuesday, making a 50% retracement of its previous decline. However, it lost all potential gains on Friday as it slid back toward the neckline at 21029.02. The Cycles Model suggests that, while the decline may have ended on Tuesday, a broken neckline may extend the Cycle Bottom another two weeks.
(Reuters) - Japan’s Nikkei dropped more than 2 percent on Friday morning, led by SoftBank, Fast Retailing and other large-cap stocks, hit by a dull estimate for a futures and options expiry and worrisome Chinese and Japanese economic indicators.
The Nikkei share average was down 1.7 percent at 21,439.16 at the midday break after falling as much as 2.1 percent. The index had climbed 3.2 percent, or 668 points, in the last two days.
For the week, the Nikkei has fallen 1.4 percent.
U.S. Dollar makes a secondary high.
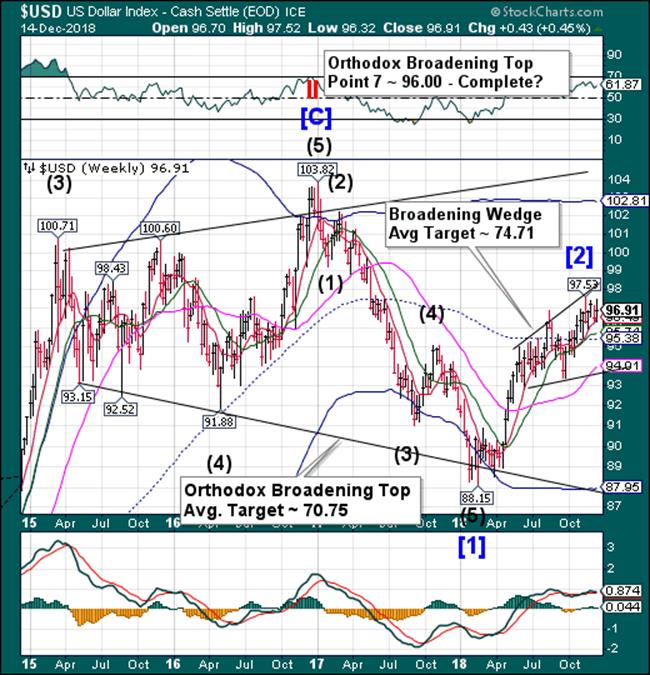
USD made a secondary high at 97.52 on Tuesday, failing a retest of the November high and confirming “Point 7” on November 12. There may have been a glitch in the data feed on Friday, as news sources report a higher price. The Cycles Model calls for a strong reversal this week. A financial jolt may send USD beneath near-term supports.
(CNBC) The dollar shone on Friday, reaching a 19-month high against a basket of currencies, as investors preferred the safety of the world's reserve currency in the wake of worrisome political and economic news outside the United States.
The Chinese yuan fell after data showed retail sales grew in November at their slowest pace since 2003 and industrial output rose the least in nearly three years. The offshore yuan shed 0.38 percent at 6.9038 per dollar. The euro weakened as the euro zone economy showed more signs of a slowdown.
Sterling tumbled as traders worried British Prime Minister Theresa May was struggling to secure assurances from the EU over her Brexit withdrawal deal.
"The dollar is not so much rallying as much as everyone else is falling," said Boris Schlossberg, managing director of FX strategy at BK Asset Management in New York. An index that tracks the greenback versus six major peers hit its highest level since May 2017 at 97.711. At 11:02 a.m. (1602 GMT), it was up 0.49 percent at 97.536. The greenback's appeal increased in the aftermath of upbeat data on domestic retail sales and industrial output.
.Gold pulls back.
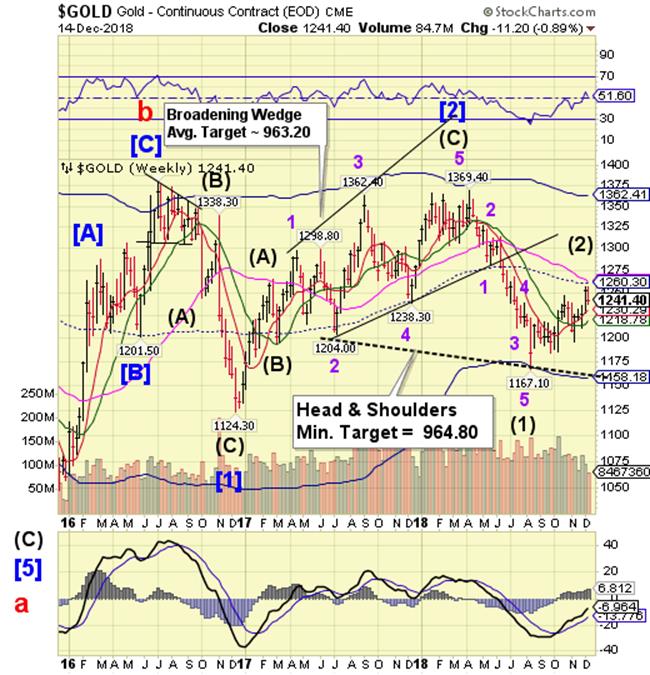
Gold pulled back from overhead resistance at 1260.30 this week, consolidating its gains. The Cycles Model calls for a return of strength with a vengeance through the end of the year. Gold may be extending the right shoulder of a potential Head & Shoulders formation before resuming its downtrend. While there is resistance at 1260.30, the Right Shoulder reaches perfect symmetry at 1275.00.
(YahooFinance) Gold markets pulled back a bit during the trading session on Friday, giving back the gains from above $1250 that were found last week. I think at this point, the 50 day EMA could cause a bit of support, and if we turn around to break above the $1250 level again, then I think we could continue to see bullish pressure to the upside. We have been trying to build a base for quite some time, so I think that jumping in and buying this market in little bits and pieces will probably be the best way to approach it. However, if we were to break down through the uptrend line on the chart, or even break down below the $1200 level, that would change a lot of things and probably send Gold down to much lower levels, perhaps down to the $1000 level.
Crude consolidates near the bottom.
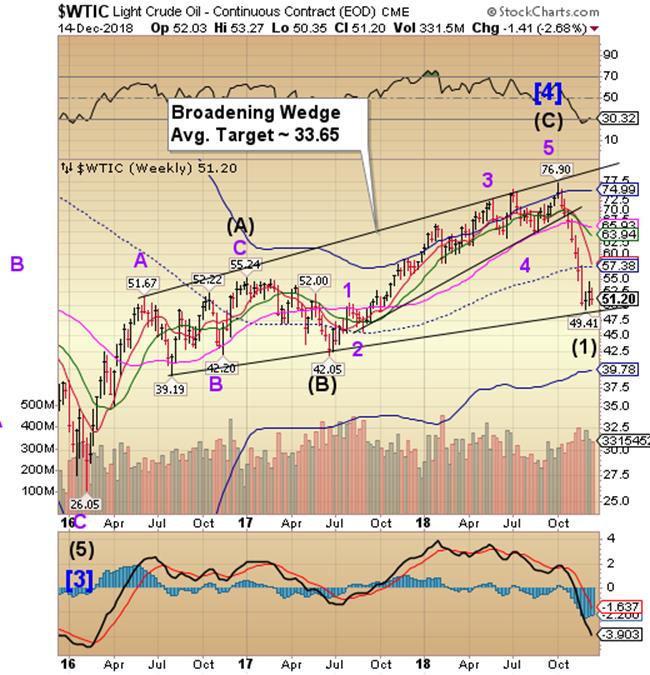
Crude oil continues to consolidate near the low this week. The Cycles Model, however, calls for a period of strength lasting through the year-end. The rally target may be as high as Long-term resistance at 65.93.
(MarketWatch) Oil prices fell on Friday, settling lower for the week, as a stronger dollar cut global demand for U.S.-priced commodities and a slide for the stock market sullied the risk-taking mood.
Meanwhile, natural-gas futures took a plunge that left them down nearly 15% for the week — the largest such loss in nearly three years, as weather forecasts dulled prospects for demand.
Oil prices had climbed Thursday as traders contemplated data showing a blip higher in monthly OPEC output even as future cuts loom, as well as a recent report of a weekly decline in U.S. crude supplies and production. Gains picked up late Thursday after a news report said Saudi Arabia plans to cut shipments to U.S. refiners to avoid an expansion of U.S. stockpiles.
Shanghai Index consolidating beneath resistance.
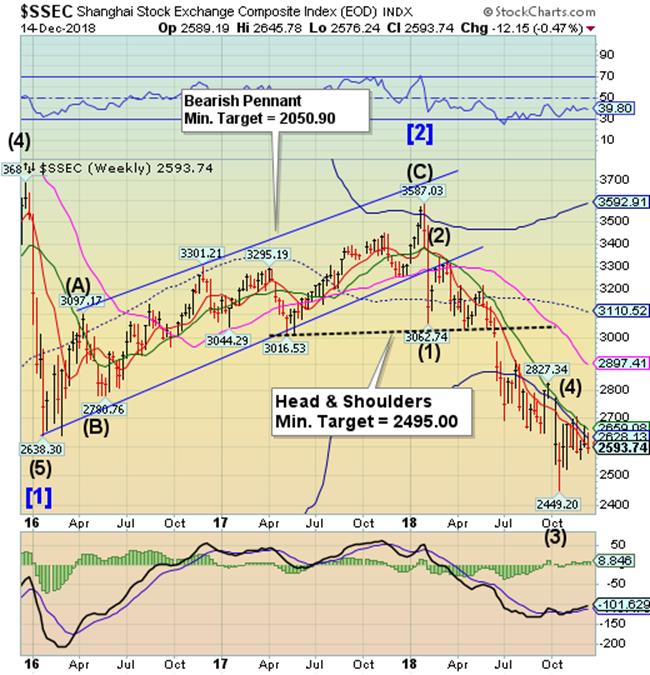
The Shanghai Index continued to consolidate beneath Intermediate-term resistance at 2628.13 this week. The Cycles Model suggests further weakness through the end of the year. Should the decline resume, it may continue with a potential bottom near 2000.00.
(ZeroHedge) With yuan unable to sustain its PBOC-inspired squeeze higher and currency volatility at three-year highs, hopes remained high that some stability can be reasserted in China's macro-economic data tonight. Those hopes have been dashed.
However, policymakers face two challenges...
Internally, policymakers’ efforts to constrain the growth of shadow banking and reduce financial risks worked almost too well. Financial regulations introduced in 2017 and early 2018 led to a meaningful contraction in shadow banking, which slowed overall credit growth and tightened credit conditions, particularly for private companies.
And externally, the escalation in US tariffs raised questions about China’s export growth and damaged confidence in the economic outlook. As a result, our China Current Activity Indicator (CAI) has fallen nearly two percentage points from its 1H2018 average of over 7%."
The Banking Index crosses the neckline.
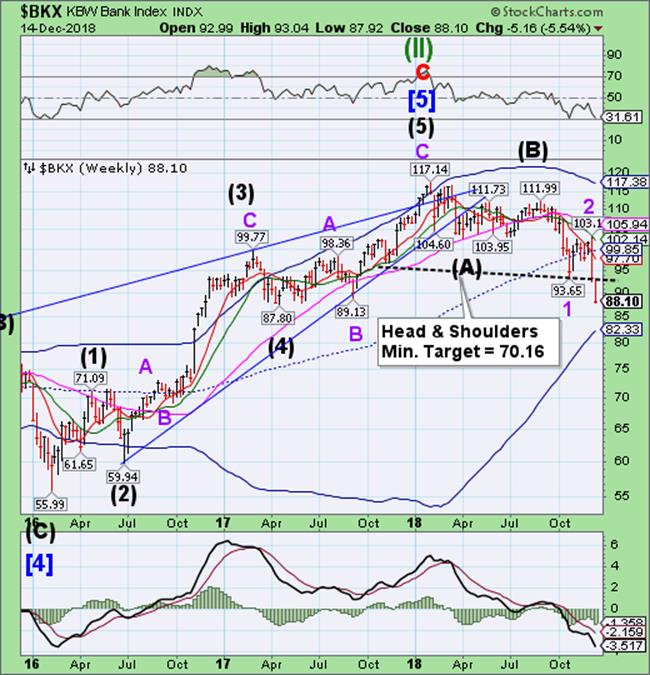
-- BKX declined beneath the Head & Shoulders neckline at 93.00, which may be the start of a panic decline. The Cycles Model calls for a significant low which may meet the implied Head & Shoulders target.
(FoxBusiness) America’s bank tellers and the branches they work in are dwindling across the nation and that could spell trouble.
“We are at a historical low with the number of banks in our country,” said Florida Bankers Association CEO Alex Sanchez during an appearance on FOX Business’ “Mornings with Maria” on Friday. “I think we are not seeing the startup banks like we used to.”
Sanchez, who oversees one of Florida’s oldest trade associations, is putting the onus on the new Congress to address this issue. Democratic Representative Maxine Waters, who takes over as chair of the House Financial Services Committee in January, which oversees the banking industry, could help.
(ZeroHedge) Despite all the ominous press being devoted to the soon-to-be-inverted yield curve, it’s not always clear why such a thing matters. In other words, how, exactly does a line on a graph slipping below zero translate into a recession and equities bear market, with all the turmoil that those things imply?
The answer (which is both simple and really easy to illustrate with charts) is that banks – the main driver of our hyper-financialized society – still make at least some of their money by borrowing short and lending long. They take money that’s deposited into savings accounts and short-term CDs (or borrowed in the money markets) and lend it to businesses and home buyers for years or decades. In normal times long-term rates are higher than short-term to compensate lenders for tying their money up for longer periods. The banks earn that spread, which can be substantial if borrowers make their payments.
When the yield curve flattens and then inverts - that is, when short rates exceed long rates - banks lose the ability to make money this way. They lend less, which restricts building and buying and spooks the broader markets.
(ZeroHedge) As we approach the end of a dismal year for European stocks, the question is: which sector had the worst year of them all?
With a few trading sessions left before the end of 2018, banks and autos are in a tight race to the bottom. As of Thursday’s close, lenders are the biggest losers, with a quarter of their market value down the drain, a wipeout of roughly 300 billion euros in shareholders’ money.
Banks haven’t seen such a bad year since the heat of the euro-zone sovereign debt crisis in 2011.
(ZeroHedge) S&P Financials are now down 20.3% from their highs - officially entering a bear market as they fall to the lowest since September 2017...
The S&P Bank index is extending losses, now down 24% from its 2018 highs and at its lowest since September 2017.
As suddenly a collapsing yield curve matters...
Regards,
Tony
Our Investment Advisor Registration is on the Web.
We are in the process of updating our website at http://mrpracticalinvestor.com/ to have more information on our services. Log on and click on Advisor Registration to get more details.
If you are a client or wish to become one, please make an appointment to discuss our investment strategies by calling Connie or Tony at (517) 699-1554, ext 10 or 11. Or e-mail us at tpi@thepracticalinve4stor.com .
Anthony M. Cherniawski, President and CIOhttp://mrpracticalinvestor.com
As a State Registered Investment Advisor, The Practical Investor (TPI) manages private client investment portfolios using a proprietary investment strategy created by Chief Investment Officer Tony Cherniawski. Throughout 2000-01, when many investors felt the pain of double digit market losses, TPI successfully navigated the choppy investment waters, creating a profit for our private investment clients. With a focus on preserving assets and capitalizing on opportunities, TPI clients benefited greatly from the TPI strategies, allowing them to stay on track with their life goals.
Disclaimer: The content in this article is written for educational and informational purposes only. There is no offer or recommendation to buy or sell any security and no information contained here should be interpreted or construed as investment advice. Do you own due diligence as the information in this article is the opinion of Anthony M. Cherniawski and subject to change without notice.
Anthony M. Cherniawski Archive |
© 2005-2022 http://www.MarketOracle.co.uk - The Market Oracle is a FREE Daily Financial Markets Analysis & Forecasting online publication.