


Will Stocks Go Nowhere Over the Next 10 Years?
Stock-Markets / Stock Markets 2019 Jan 30, 2019 - 11:01 AM GMTBy: Troy_Bombardia

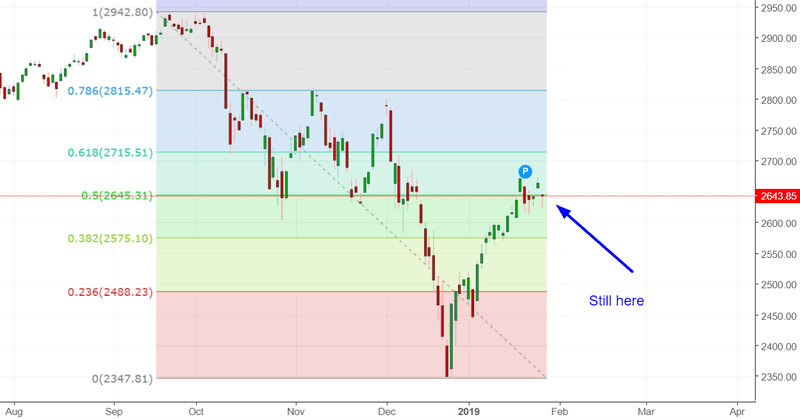
The U.S. stock market has held up well during this earnings season. Now that earnings season is over, many traders are looking for a pullback/retest. Overall, the statistical evidence for a pullback/retest remains strong and convincing.
Go here to understand our fundamentals-driven long term outlook.
Let’s determine the stock market’s most probable medium term direction by objectively quantifying technical analysis. For reference, here’s the random probability of the U.S. stock market going up on any given day.

*Probability ≠ certainty. Past performance ≠ future performance. But if you don’t use the past as a guide, you are blindly “guessing” the future.
Will the next 10 years be worse for stocks than the past 10 years
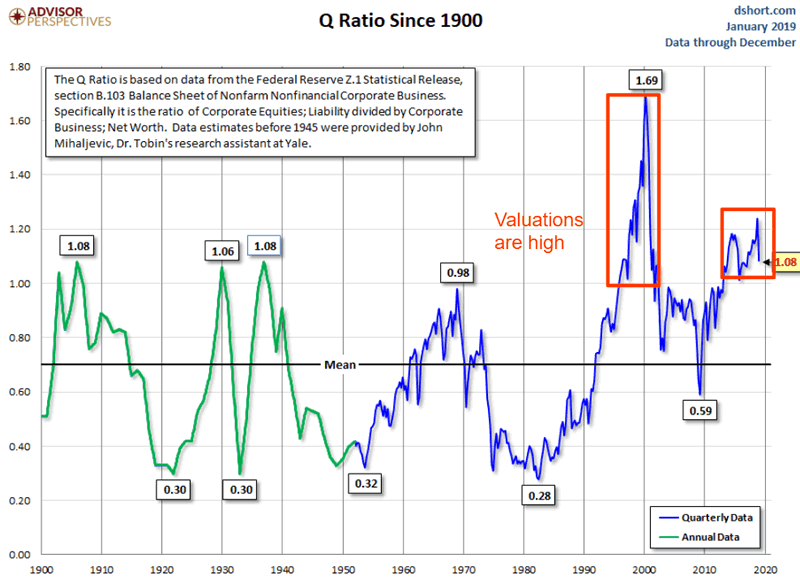
The biggest argument that long term bears use to support their case is “stocks are overvalued, so CRASH CRASH CRASH”. They’ve been repeating this message for almost a decade now.
Over the past year, I’ve shown that valuations play a minor role in determining the stock market’s forward returns. Of much more importance is the state of the economy.
- When the economy is growing, the stock market’s long term direction is bullish (it’s a bull market)
- When the economy is deteriorating, the stock market’s long term direction is bearish (it’s a bear market).
These charts plot the S&P’s valuations (P/E Ratio) against its 1 year and 2 year forward returns.
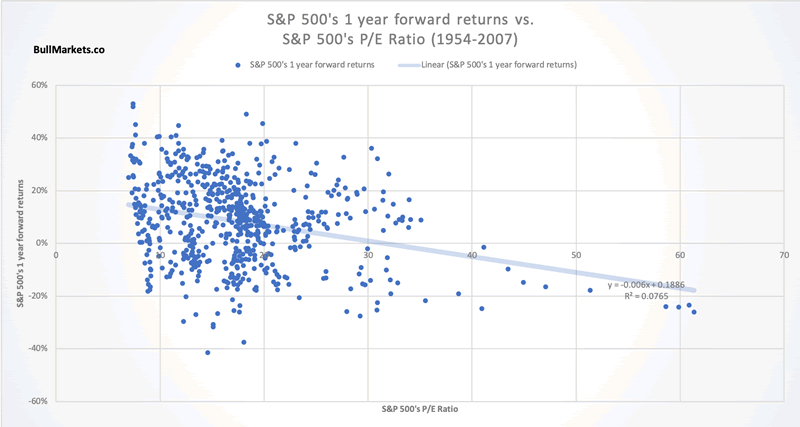
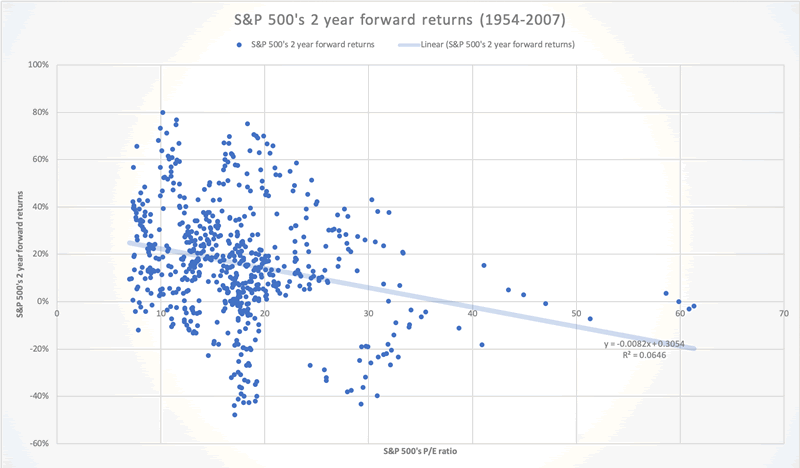
As you can see, R squared is very low. Valuations explain less than 8% of the stock market’s forward returns over the next 1-2 years. This is not much better than flipping a coin.
As a result, some bears have resorted to using valuations to predict the stock market’s returns over the next 10 years.
Here’s the S&P’s valuation (Shiller P/E Ratio) plotted against the S&P’s 10 year forward returns, from 1900-2008. As you can see, valuations play a bigger role in predicting returns, but once again it is not a huge role (R squared = 0.16)
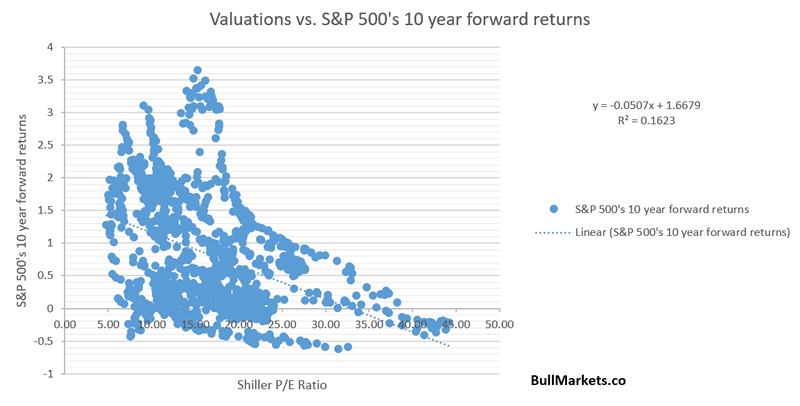
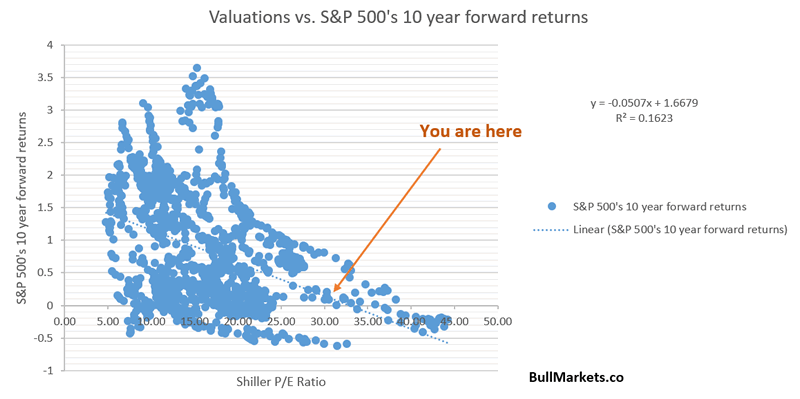
Valuations are high right now. Based on the above chart, the bears are predicting that “the stock market will go nowhere over the next 10 years – close to 0%”.
These statements are slightly misleading.
The stock market never goes flat for 10 years.
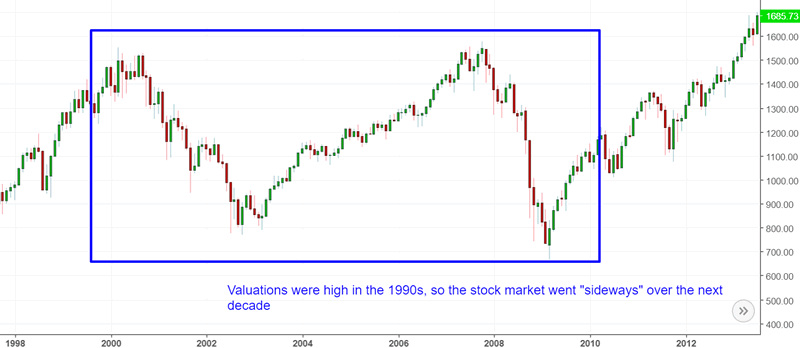
Here’s how the bears explain the 1990s and 2000s: valuations were very high in the 1990s. As a result, the S&P went “sideways” over the next 10 years.
This is misleading. When someone says “the stock market’s forward returns over the next decade will be zero”, it gives you the impression that the stock market will go nowhere over the next 10 years.
This is not true. Yes, the S&P 500 went sideways from 2000-2010. However, there were MASSIVE bull markets and bear markets. Someone who completely avoided the stock market because “stocks will go nowhere” would have missed out on a lot of opportunities.
Similarly, valuations were very high by the late-1960s. While the stock market went “nowhere” in the 1970s, there were MASSIVE up and down swings. Investors who avoided the stock market would have missed out on big opportunities. It would have been more prudent to ride the bull markets and sidestep the bear markets.
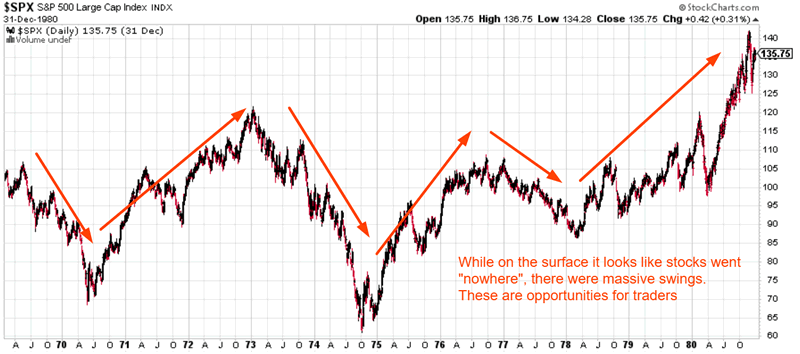
We cannot predict that the S&P will go nowhere over the next 10 years. We can only predict that the next decade won’t be as easy for those who buy and hold as it has been over the past decade. It will be more of a trader’s market, with massive up and down swings.
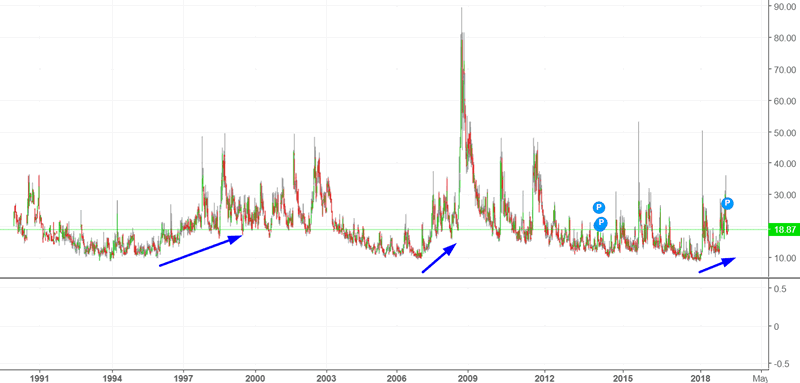
Yield curve and VIX
Last year I said that VIX would start to trend higher. Historically, VIX tends to trend higher towards the end of a bull market because the stock market’s volatility increases.
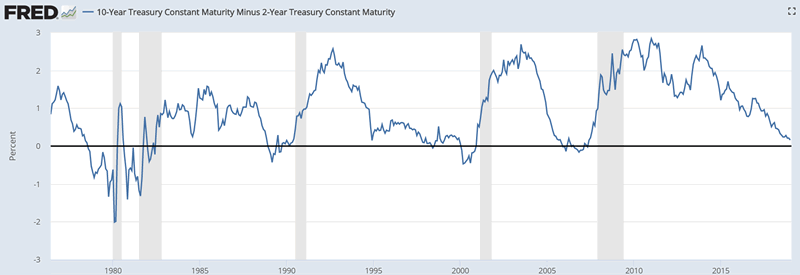
Here’s another way to look at this. This is the 10 year – 2 year yield curve. As it flattens, the economy gets closer and closer to a recession.
This is the yield curve (flipped on its head) overlapped with VIX. I have shifted the yield curve 2 years into the future, giving it a 2 year lead time against VIX.
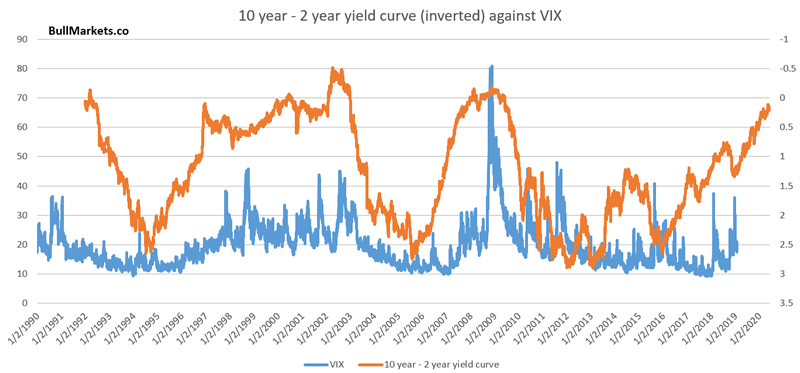
As you can see, VIX tends to trend upwards in the long term as the yield curve comes close to inverting.
This is why VIX will probably not revisit levels seen in 2017. Even if the S&P 500 makes new all-time highs, volatility is here to stay. The stock market gets very choppy towards the end of every bull market because there’s a war going on.
- Buy and hold investors have been conditioned by a long bull market to constantly buy the dip because “stocks always go up in the long term”.
- More and more market timers are stepping out of the way and selling stocks.
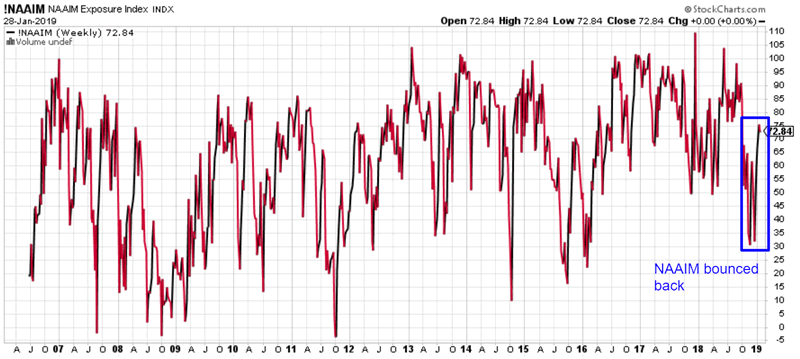
NAAIM Exposure Index
The NAAIM Exposure Index measures the average exposure to U.S. equities among investment managers. It tanked in Q4 2018 along with the stock market. Now that the stock market has rallied, exposure has also increased.
Here’s what happens next to the S&P 500 when NAAIM Exposure goes from under 31 to above 75
*Data from 2006-present
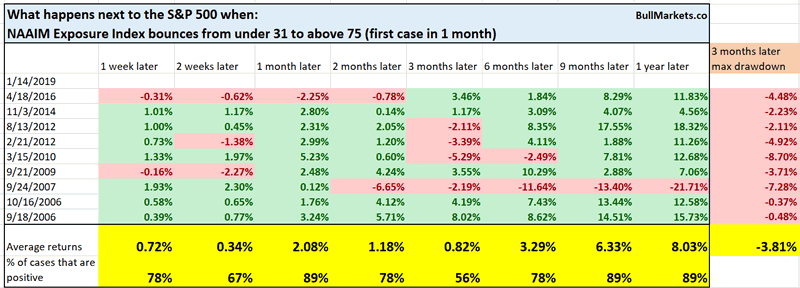
As you can see, the stock market does well over the next 1 month, but forward returns deteriorate 3 months later.
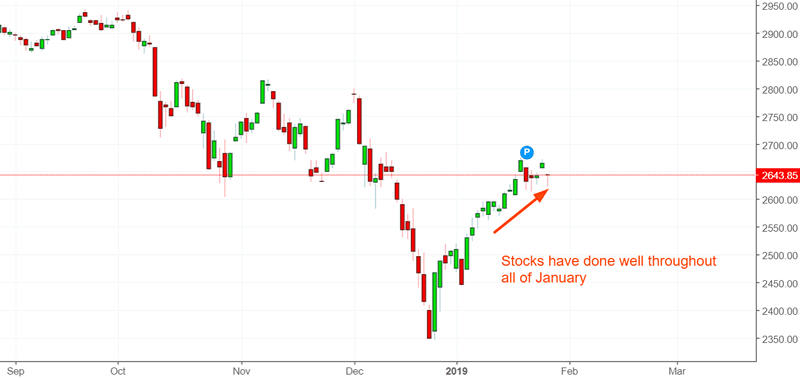
*Keep in mind that the most recent signal date was January 14. 1 month later = mid-February, and 3 months later = mid-April. Stocks have indeed rallied over the second half of January 2019.
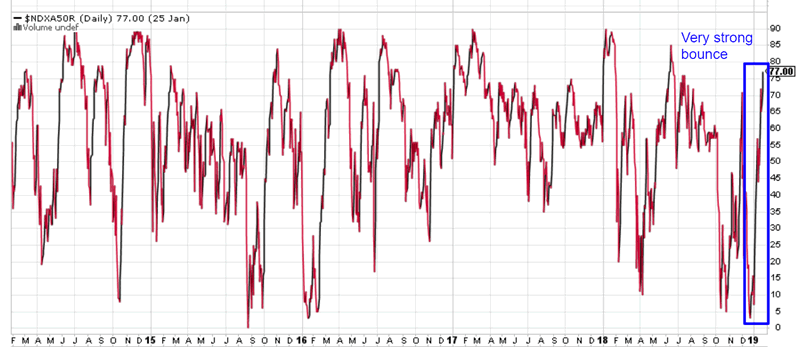
NASDAQ’s breadth
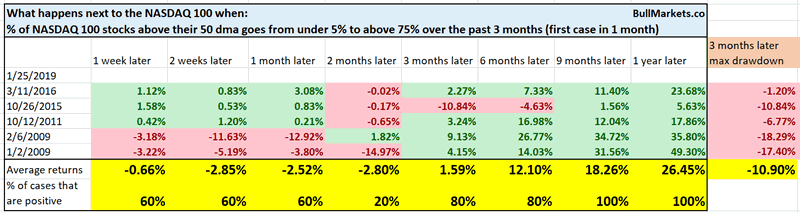
The NASDAQ 100’s breadth has surged along with the NASDAQ itself. The % of NASDAQ 100 stocks above their 50 day moving average has gone from under 5% (an extremely low reading) to above 75%.
Here are similar instances, and what the NASDAQ 100 did next.
Here are similar instances, and what the S&P did next.
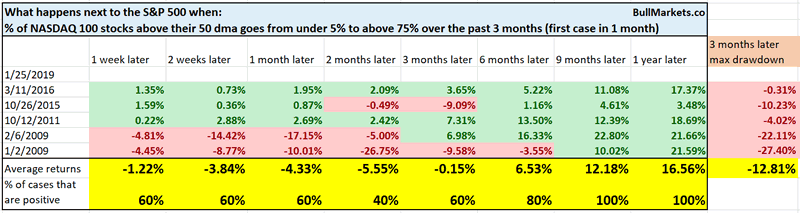
Once again, you can see that forward returns are worse 2 months later. This demonstrates that most “crash and surge” patterns are followed by a retest.
Long term returns are very bullish, but as I’ve explained before, this time is probably different. Such breadth extremes were previously only registered at the bottom of equity bear markets. But with the rising popularity of ETFs, stocks are becoming more and more correlated to eachother. Hence, breadth extremes are going to be more and more common.
S&P 500 Equal Weighted Index
Some investors prefer the S&P 500 Equal Weighted Index instead of the S&P 500 itself (a market cap weighted index). The argument is that Equal Weighted tends to outperform over the long run.
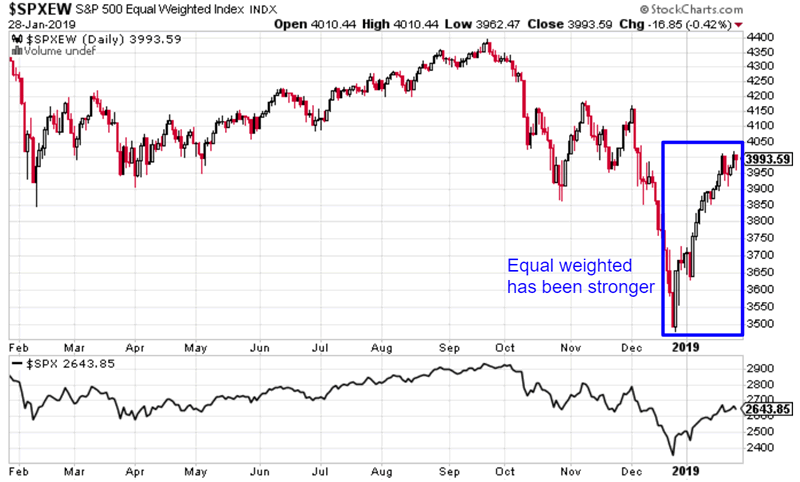
The Equal Weighted Index has significantly outperformed the Market Cap Weighted Index over the past month.
- Equal Weighted is up more than 8.3%
- Market Cap Weighted (normal S&P 500) is up less than 6.3%
Here are similar instances, and what the S&P 500 did next.
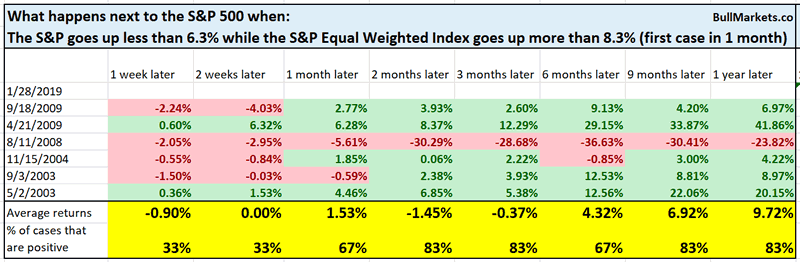
As you can see, the stock market’s returns over the next 1-2 weeks lean bearish.
Macro Context
Click here for yesterday’s market study
Conclusion
Here is our discretionary market outlook:
- The U.S. stock market’s long term risk:reward is no longer bullish. This doesn’t necessarily mean that the bull market is over. We’re merely talking about long term risk:reward. Long term risk:reward is more important than trying to predict exact tops and bottoms.
- The medium term direction (i.e. next 3-6 months) is neutral. Some market studies are medium term bullish while others are medium term bearish
- The stock market’s short term has a bearish lean due to the large probability of a pullback/retest. Focus on the medium-long term (and especially the long term) because the short term is extremely hard to predict.
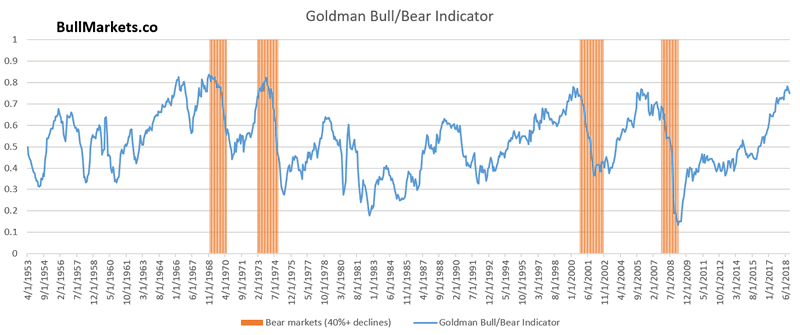
Goldman Sachs’ Bull/Bear Indicator demonstrates that while the bull market’s top isn’t necessarily in, risk:reward does favor long term bears.
Our discretionary market outlook is not a reflection of how we’re trading the markets right now. We trade based on our clear, quantitative trading models, such as the Medium-Long Term Model.
Members can see exactly how we’re trading the U.S. stock market right now based on our trading models.
Click here for more market studies
By Troy Bombardia
I’m Troy Bombardia, the author behind BullMarkets.co. I used to run a hedge fund, but closed it due to a major health scare. I am now enjoying life and simply investing/trading my own account. I focus on long term performance and ignore short term performance.
Copyright 2019 © Troy Bombardia - All Rights Reserved
Disclaimer: The above is a matter of opinion provided for general information purposes only and is not intended as investment advice. Information and analysis above are derived from sources and utilising methods believed to be reliable, but we cannot accept responsibility for any losses you may incur as a result of this analysis. Individuals should consult with their personal financial advisors.
© 2005-2022 http://www.MarketOracle.co.uk - The Market Oracle is a FREE Daily Financial Markets Analysis & Forecasting online publication.