Stacking The Next QE On Top Of A $4 Trillion Fed Floor
Interest-Rates / Quantitative Easing Feb 18, 2019 - 05:44 PM GMTBy: Dan_Amerman
 The Federal Reserve is currently communicating to the markets that it will likely pivot, and pause two strategies. The first pivot is to stop increasing interest rates. The second pivot is to stop unwinding the Fed balance sheet.
While the interest rate pause is getting the most attention - the balance sheet pause could be the most important one for investors over the coming years.
As explored herein, the impact of pausing the unwinding the balance sheet is to create a new floor at about $4 trillion in Federal Reserve assets. And if the business cycle has not been repealed and there is another recession - the Fed fully intends to go back to quantitative easing, potentially creating more trillions of dollars to be used for market interventions, and to stack another round of balance sheet expansion right on top of the previous round.
That could change everything.
This analysis is part of a series of related analyses, an overview of the rest of the series is linked here.
The First Round Of Balance Sheet Expansion
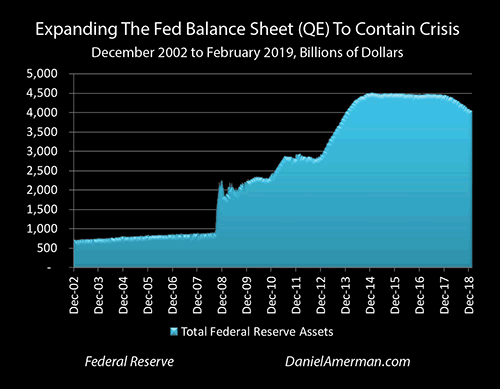
The graph above shows the radical expansions of the Federal Reserve balance sheet during and after the financial crisis of 2008. The Fed began September of 2008 with about $900 billion in assets, and it can easily be seen that the growth in assets in previous years had been a very steady and slow process.
Two months later, by the beginning of November of 2008, the assets owned by the Federal Reserve had more than doubled to about $2.1 trillion, creating a dramatic spike of over $1 trillion in new assets.
The Fed needed that first $1+ trillion so that it could loan it to the investment banks and stop a bank run in process that would've likely essentially wiped out the global financial system in a matter of weeks or months. However, the money to make the new loans simply wasn't there, so the Fed just created the trillion dollars via a process known as quantitative easing or QE. In doing so, the Fed also "pulled back the curtain" and unmistakably proved that money isn't what most people think it is to this day.
From that point the Fed was supposed to rapidly "shut the curtain" again, and make the banks repay the loans once the height of emergency had passed. These loans were the new assets on the Federal Reserve balance sheet, and as they were paid back, the newly created trillion dollars were supposed to rapidly disappear back into the nothingness from which they had come, as the Federal Reserve balance sheet would shrink back to its previous level. That was the initial plan - this incredibly bizarre situation (by previous standards) was supposed to be a one time and very brief anomaly, to be used only in the most dire of emergencies.
And indeed, if we look closely at the graph, we can see that the promised unwinding process did start and it did so quite rapidly. The Federal Reserve balance sheet initially peaked at $2.25 trillion in December of 2008, and swiftly fell by $400 billion in the next two months to $1.84 trillion, meaning that the Fed was on pace to get back to a normal balance sheet - and normal money - by the summer of 2009.
However, the United States was in the midst of the Great Recession, and as explored in the analysis linked here, the Fed for the first time in decades lacked the "ammunition" to exit the recession using its primary weapon. Interest rates started too low, and even slamming them all the way down to zero percent, wasn't enough to jolt the economy out of recession.
So the mission changed - and the Fed didn't give the money (and the power) back after all. While very people remember it today - because very few people understood what was happening at the time - the Fed reneged on its promise in the second half of February of 2009. Even once the recession formally ended, the "recovery" was still faltering and slow, so the Federal Reserve began a new round of balance sheet expansion instead of reduction, with a goal of stabilizing and stimulating the economy. Neither money nor the investment markets have been the same since that time.
As a very quick summary, the Fed used quantitative easing to create still more money and for a while the Fed essentially funded new originations for the entire mortgage-backed securities market. In doing so the Federal Reserve effectively funded the purchase of every home that was being bought with a conventional mortgage in the United States - at interest rates below what they have otherwise been - in order to save the housing industry and home values.
The Fed then moved on to QE2 (quantitative easing two) and effectively funded the U.S. government's growing deficits during a time of stimulus spending with still more newly created money, even while taking an unprecedented degree of control over medium and long-term interest rates.
Assets reached a peak of about $4.5 trillion by December of 2014 - six full years after the crisis which had been the initial justification for creating the trillions in new money - and the Fed then stopped the expansion for about three years. It went to a neutral posture where it neither expanded the balance sheet nor shrank it, but it instead merely replaced assets at the rate at which they matured.
In November of 2017 - about nine years after the first expansion - the Federal Reserve finally began a very slow process of balance sheet reduction, i.e. "quantitative tightening". There were no asset sales (which might require recognition of some of the fantastic losses currently hidden on the Federal Reserve balance sheet), but the Fed stopped replacing assets as they matured. As can be seen on the far right of the graph, the Federal Reserve balance sheet shrank by about $400 billion over the next 15 months.
However, there was a problem - the markets couldn't handle even that very slow retreat from the fantastic and the abnormal. The creation and spending of money by the trillions for governmental purposes without going through taxation - which was supposed to a very temporary anomaly to be used in only the most dire of emergencies - had over the years become the normal, and then a foundation of elevated market valuations, where this extraordinary intervention could not be withdrawn without precipitating a crash in the markets that had become dependent upon it.
So at the very same time that the Fed will apparently be pausing its cycle of increasing interest rates because of fears about the economy and the markets, it is now also discussing pausing the unwinding of its grossly inflated balance sheet.
What that means then is that we effectively have not a ceiling on assets of about $4.5 trillion, but a new floor for Federal Reserve assets of about $4 trillion (or perhaps a little less, if the official pause starts later in 2019).
Assuming that the business cycle has not been repealed and that there is another recession at some point, then there is ample reason to believe that something around $4 trillion will indeed be the starting floor, and in any future recession (and its aftermath) the Federal Reserve will use new rounds of quantitative easing to stack trillions of dollars in new assets on top of that floor.
The Dilemma & The Planned Solution
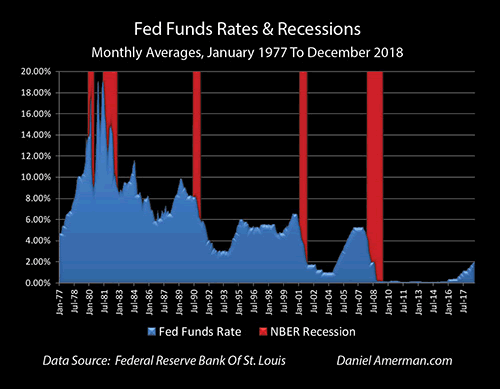
The issue is, as explored in a previous analysis (link here), is that there are currently a number of warning signals that we may be coming into a recession within somewhere around the next one to two years. As covered in the analysis linked here, we also know what happens what will happen with close to 100 percent certainty if we have another recession - the Fed will slam interest rates back down to zero percent.
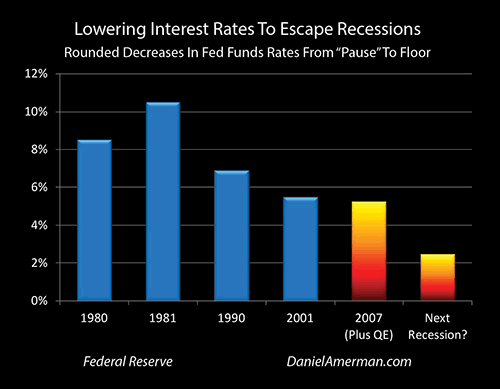
The underlying problem that helped precipitate the introduction of quantitative easing and why the Federal Reserve balance sheet grew from less than a trillion dollars to $4.5 trillion can be seen above.
Interest rates started too low coming into the 2007 recession. They had been lowered to fifty-year lows in the 2001 recession, the Fed was trying to raise rates high enough to be able to slam them down in the next recession - but they were unable to do so, and had to "pause" in 2006 because of market and economic concerns (and if that sounds like today, it should).
Coming into a particularly nasty recession with insufficient room use its primary tool - rapidly slamming down interest rates - after the first round of crisis containment, the Fed eventually went to a strange and fantastic new secondary tool for maintaining stability while stimulating the economy. This new tool was quantitative easing and the rapid expansion of the Federal Reserve balance sheet.
The issue today as can easily be seen above, is that interest rates are much lower today with they were with the 2006 pause, meaning that the Fed's primary tool is likely to be even less effective for shortening and ending the next recession. This is happening even we see multiple signs of a possible new recession on the way.
The Fed is very well aware of this dilemma, and its staff has been discussing what to do about it. As explored in much more detail in my 2019 Cycles Overview, two excerpts from the staff discussion at the August 1, 2018 meeting of the Federal Open Market Committee are of particular interest.
“...spells at the ELB could become more frequent and protracted than in the past, consistent with the staff’s analysis.”
“Participants generally agreed that both forward guidance and balance sheet actions would be effective tools to use if the federal funds rate were to become constrained by the ELB. In the Addendum to the Policy Normalization Principles and Plans statement issued in June 2017, the Committee indicated that it would be prepared to use its full range of tools, including altering the size and composition of its balance sheet, if future economic conditions were to warrant a more accommodative monetary policy than can be achieved solely by reducing the federal funds rate.”
The ELB is Fed-speak for zero percent interest rates, so with the next recession, the plan is to first move the target federal funds rate straight back to the 0% to 0.25% range. However, the Fed knows perfectly well that current interest rates are starting too low for interest rate reductions to be as effective as they were in the past.
The Federal Reserve knows they are likely to need something more than just another (potentially protracted) round of zero percent interest rates to get the economy going again in the manner that the nation has become accustomed to in the post World War Two era. So their plan - right now and in advance - is that they will likely use a new round of "balance sheet expansion" to stimulate the economy.
And if the Fed does indeed pause the current very slow unwinding of the balance sheet in 2019 as appears likely, and they then do go to balance sheet expansion as expected in the next recession, it means that they will stacking trillions in new expansion right on top of the approximately $4 trillion "floor" remaining from the last round of the containment of crisis.
Stacking Of Balance Sheet Expansions Illustration - Simple Repetition
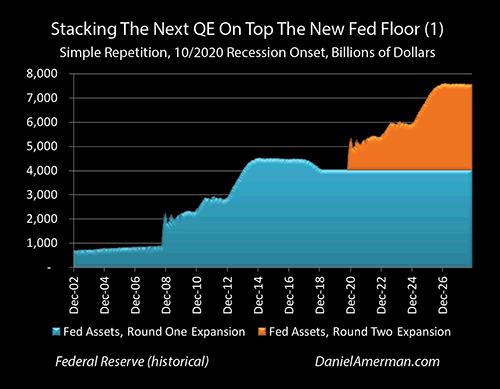
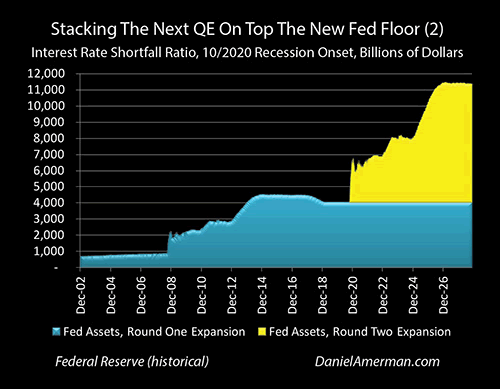
If the balance sheet contraction pause continues, this means there is a new floor of about $4 trillion in Federal Reserve assets, as can be seen with the level blue area on the right side of the illustration graph above.
To the extent we have another recession, and starting interest rates are not sufficiently high for lowering interest rates to by itself get us out of that recession, then the Fed says the first thing they will do in combination with moving interest rates back to zero percent is to just stack a new QE on top of the last one.
They don't use those exact words but if we pause the unwinding, then a floor is created, and if there is then another round of balance sheet expansion, then the new round simply stacks on top of the prior round, as illustrated above.
For this simple illustration we assume a recession in October of 2020, which is about 20 months out from the time this analysis was first prepared. The issues are complex, but the simplest way to look at this is just as an exact duplication, knowing now that many of the specifics are likely to be different in practice, but in ways that we can't know at this moment. To avoid getting bogged down in theories and assumptions, the cleanest illustration is to simply repeat the past, albeit with the difference that because balance sheet expansion is now a planned policy instrument rather than a last ditch "Hail Mary" effort, it would start with the beginning of the recession.
If we have a new round of QE that is stacked on top of the old QE then we have the orange area on the graph stacked on top of the blue area - and the Federal Reserve balance sheet would be up to over $5 trillion within a month of the onset of the next recession. This is a quick increase of a little over $1 trillion - and is just a dollar for dollar repeat of what happened in 2008.
If the future were like the past, then the stacking of QE on top of QE would bring the Fed to a $6 trillion balance sheet by the beginning of 2024, and total assets would be over $7 trillion by the end of 2025.
Keep in mind that this would all be financed by pure monetary creation, making still more new trillions of dollars out of the nothingness, and using that newly created money to make investment asset purchases on an extraordinary basis - completely distorting prices and yields - even while zero percent interest rates are simultaneously dominating the investment markets, while also distorting prices and yields.
Stacking Expansions While Compensating For Lower Interest Rates
However, there is an issue, which is that it appears likely that we will have a double pause sometime in 2019, and the two are closely related. The Fed took two radical actions in the containment of the last round of crisis, zero percent interest rates and creating trillions in new money to purchase real assets while distorting the markets. It was attempting to get both back to more normal levels before the next recession hit - but it appears that it couldn't do it with either.
The markets and the economy appear to be too fragile to handle normalization for interest rates or the normalization of the Federal Reserve balance sheet, so there are apparent pauses occurring with both a $4 trillion balance sheet and with Fed Funds rates.
It is worth repeating the graph above to take another looks at rates now, versus where they were with prior recessions. Interest rates are far lower than they were when the previous pause occurred in 2006 - which means that Fed is starting with much less ammunition than it had the last time around. This then means that the reliance on quantitative easing may need to be much greater than it was the last time around, which means that the expansion of the Federal Reserve balance sheet may also need to be much greater.
Just how much more quantitative easing could be "needed" (from the way the Fed now views the world) is another of those complex questions that we can't be sure of today, however, we can use a simple ratio to get into a very approximate ballpark for illustration purposes.
If we look at the blue bars of the four recessions on the left side, those of 1980,1981, 1990 and 2001, then the average interest rate reduction from the time the prior cycle of increasing interest rates was paused, down to subsequent floor, was about 7.85% (as covered in more detail in the analysis linked here).
Since each those four recessions were contained and exited without the need for quantitative easing, we'll use that 7.85% average as a proxy for what has been needed to cleanly exit recession with interest rate reductions only, over the period of the last four decades (understanding that each recession is different and the differences are complex).
When we look at the recession of 2007, rates were at approximately 5.25% before they were slammed down to zero - and that wasn't nearly enough, so quantitative easing was introduced. There was about a 2.60% shortfall if we compare the 7.85% average to the 5.25% starting point in 2007, and the end result was covering the difference with about $3.5 trillion in balance sheet expansion.
In early 2019 the approximate Fed Fund rate was about 2.45%. That is about a 5.40% shortfall compared to the average interest rate reductions used to exit the four recessions between 1980 and 2001. That 5.40% shortfall is about 2.08 times as great as the 2007 shortfall of 2.60%.
So for a simple ballpark illustration - understanding the involved issues are far more complex - let's look at a round two QE that is 2.08 times as great as the first round of QE, on the basis that the interest shortfall being covered by QE is 2.08 times as great.
Using the interest rate shortfall ratio, there would need to be a radically greater expansion of the Federal Reserve balance sheet - it would now top out at over $11 trillion.
The speed with which the Fed would purchase assets and expand the balance sheet would need to be far faster because of the greater reliance on the secondary weapon of quantitative easing. That would mean that the Federal Reserve balance sheet would now be about $6 trillion by November of 2020, weeks after the start of the 35th cycle of recession (since 1854).
The $7 trillion mark would be reached by December of 2022, and $8 trillion by July of 2023. Federal Reserve assets would balloon to over $10 trillion by November of 2025, and the asset purchases made by the Fed over those years would likely distort investment prices and investment yields across all investment categories to a fantastic and unprecedented degree.
The Fed would now peak above $11 trillion in assets by May of 2026, and would likely stay there for years - potentially until the next phase of the business cycle occurred. With a 36th cycle of recession, round three of quantitative easing would then stack above the new floor of $11 trillion in Federal Reserve assets (or perhaps $10 trillion if there is another round of "minor" unwinding in the future, before another pause).
The New Cycle
We have a new cycle in town - or least, that appears to be the intent of the Federal Reserve.
The abrupt creation and spending of a trillion dollars in October through December of 2008 by the Fed was a bizarre anomaly at the time, something that most market experts would have assured us was impossible - until it happened.
It was supposed to be a fleeting bending of the rules regarding what money is supposed to be, staying in existence for just long enough to cure an otherwise impossible situation.
Quantitative easing and balance sheet expansion were then supposed to wink right back out of existence. Normality was supposed to return, and QE was supposed to be put back in the theoretical tool kit, studied by graduate students in economics but only applied in the real world in the most dire of emergencies, perhaps once every few decades.
What a difference a decade makes.
Power is addictive.
And it turns out that the Federal Reserve loved the radical new expansion of power that ongoing QE and balance sheet expansion gave it. The Fed was no longer trying to somehow indirectly influence things, but was instead creating and spending trillions to quite directly intervene in the markets - while making sure that the markets understood there were trillions more where that came from, if anyone were to be so foolish as to try to fight the Fed.
As it turned out, the markets didn't fight the Fed on QE - because they love QE and have indeed become dependent on QE. The artificially low yields and stability created by balance sheet expansion, and the knowledge that a future "Fed Put" could be funded to whatever degree was necessary by monetary creation, let asset prices in most investment categories climb to elevated levels that are far above where they would likely be without balance sheet expansion.
Because current asset prices - and the asset price path history travelled over the last decade - are so dependent on quantitative easing and balance sheet expansion, the Fed has been quite fearful to withdraw this "protection". This fear is why the Fed didn't even start unwinding for three years after the expansion stopped, it explains why the Fed did such a slow and tentative job of unwinding a small part of its expanded balance sheet, and it explains why the Fed is currently discussing pausing the unwinding so early, with what is still a $4 trillion balance sheet.
The Fed knows perfectly well that a rapid unwinding of its balance sheet could trigger catastrophic collapses in multiple markets, such as stocks, bonds and REITs - and the institutional markets know it as well.
So, the Federal Reserve is being very, very careful. This is why it appears that we may have a new floor at around $4 trillion in Fed assets.
And if we indeed have a new floor - and if the Fed response to the next recession and iteration of the business cycle is to do as planned and move immediately to stack another round of QE on top of the last round - then we have a new cycle that moves with the business cycle.
This cycle is now a stacking of extraordinary interventions, with each cycle cumulatively further changing the nature of money (and the power of the Federal Reserve), even as each cycle cumulatively moves investment prices - in all categories - to places that are farther away from where they would be if they had been determined by free markets.
The Investment Implications
For most people, things like quantitative easing and monetary policy are some fairly esoteric stuff. Oh, some people are quite interested and informed, and this is particularly true among financial and economic professionals.
However, when it comes to most of the population, relatively few people pay much attention to things like quantitative easing when it comes to making personal investment choices, such as asset allocation percentages between cash, stocks, bonds, REITs and precious metals in their retirement or other investment portfolios.
But yet, the price and return paths traveled by stocks, bonds, REITs and precious metals would have all been entirely different over the last decade if it were not for balance sheet expansion. As a starting point, the global financial system would likely have collapsed in late 2008, and absolutely everything would have changed right there.
From that quite different starting point, then different perceptions for risk in each category - as well as potentially quite different interest rates and inflation rates - means that prices and returns for stocks, bonds, REITs and precious metals would have likely travelled quite different paths if it had not been for the six years of the Fed creating trillions of dollars and using the money to directly intervene in markets. Most people's financial results and current financial positions would likely be quite different, and most people's current perceptions about good investment strategies for the future would likely be different as well.
Now, quantitative easing and balance sheet expansion were far from the only influence on individual investment results - there were many other important factors driving the markets - but they were: 1) one of the "biggies"; and 2) a new game in town.
And as concerns grow about a possible recession in the next 1-2 years, even as the Federal Reserve considers pausing the very small amount of balance sheet reduction it has already done, and even as the Fed contemplates going to immediate balance sheet expansion in the event of the next recession - it looks like we have a new cycle. And this new cycle of stacking extraordinary interventions could change our personal future investment results - and optimal investment strategies - across all of the investment categories.
What do we know about this cycle and what is the practical impact on investment strategies? That is a subject that take a lot more room than can be covered at the end of an analysis that is already growing long (which is why I write series of analyses rather than just single stand alone analyses), but let me suggest that there are three particularly important considerations.
1) The new cycle of "deus ex machina" market interventions creates amplified losses at some points in the underlying business cycle, for reasons that are not part of traditional investment theory or financial planning;
2) The new cycle of outside market interventions has to date created record profits in multiple investment categories at other points in the business cycle - including stocks, bonds, real estate and precious metals - for reasons that are also not part of traditional investment theory or financial planning;
3) The amplified losses and amplified profits that result from the new cycle of stacking interventions are not random but can be at least partially anticipated in advance through understanding the double trap (of its own making) that the Federal Reserve is now caught in over the long term, and anticipating the market effects of the known strategies that the Fed has been using in the past and/or intends to use in the future.
Because I believe the Fed's increasingly heavy-handed interventions have created cycles of crisis and the containment of crisis which are very important for individuals to understand, I created the framework below to help explain how these new changes in the cycles can change investment category results at various stage in the cycles.
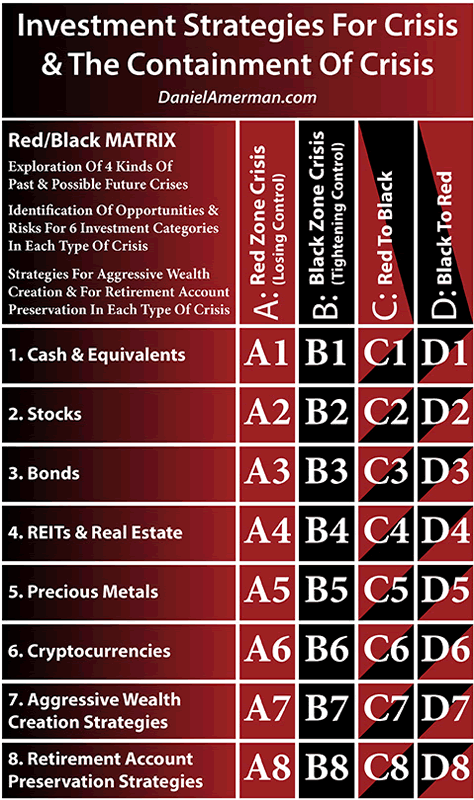
An explanatory analysis for the matrix is linked here.
The stages in the cycles are the columns and the individual investment category results in each stage are the rows.
A new cycle of stacking rounds of quantitative easing on top of each other is something that changes the columns. The black "B" column of the containment of crisis now works differently than it has at any prior time. We have all been experiencing this with asset prices across all the categories over the last ten years.
Because the "D" column of the markets and economy going from the containment of crisis to crisis starts at a different level, that means the rapid price and return movements for each investment category - such as stocks, bonds and REITs - work differently than they otherwise would, with different risks and returns for the next iteration of recession.
Because balance sheet expansion is a quite different form of containing crisis than what we had ever experienced before 2008, this also means that column "C", the sharp price and return changes as the new recession ends, and the economy and markets move to the next economic expansion also works quite differently than it used to, with different risks and returns.
The present is not like the past. The future is unlikely to be like the past - for it appears that we are likely to have a new cycle in town. I hope that this analysis has been useful to you in understanding this new cycle.
Daniel R. Amerman, CFAWebsite: http://danielamerman.com/
E-mail: mail@the-great-retirement-experiment.com
Daniel R. Amerman, Chartered Financial Analyst with MBA and BSBA degrees in finance, is a former investment banker who developed sophisticated new financial products for institutional investors (in the 1980s), and was the author of McGraw-Hill's lead reference book on mortgage derivatives in the mid-1990s. An outspoken critic of the conventional wisdom about long-term investing and retirement planning, Mr. Amerman has spent more than a decade creating a radically different set of individual investor solutions designed to prosper in an environment of economic turmoil, broken government promises, repressive government taxation and collapsing conventional retirement portfolios
© 2019 Copyright Dan Amerman - All Rights Reserved
Disclaimer: This article contains the ideas and opinions of the author. It is a conceptual exploration of financial and general economic principles. As with any financial discussion of the future, there cannot be any absolute certainty. What this article does not contain is specific investment, legal, tax or any other form of professional advice. If specific advice is needed, it should be sought from an appropriate professional. Any liability, responsibility or warranty for the results of the application of principles contained in the article, website, readings, videos, DVDs, books and related materials, either directly or indirectly, are expressly disclaimed by the author.
© 2005-2022 http://www.MarketOracle.co.uk - The Market Oracle is a FREE Daily Financial Markets Analysis & Forecasting online publication.


