HUI Update…A Treat for Long Suffering Gold Traders
Commodities / Gold and Silver Stocks 2019 Feb 20, 2019 - 01:03 PM GMTBelow is the combo chart which has the HUI on top, the UUP in the middle and GLD on the bottom. Everything looks fine.

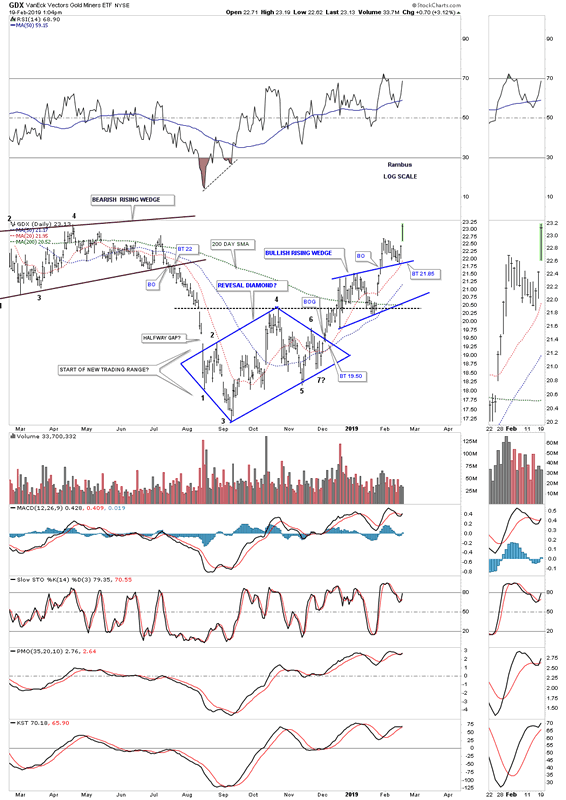
The GDX daily chart shows a nice breakout and backtest to the top rail of the bullish rising wedge and now the door is open for a move higher.

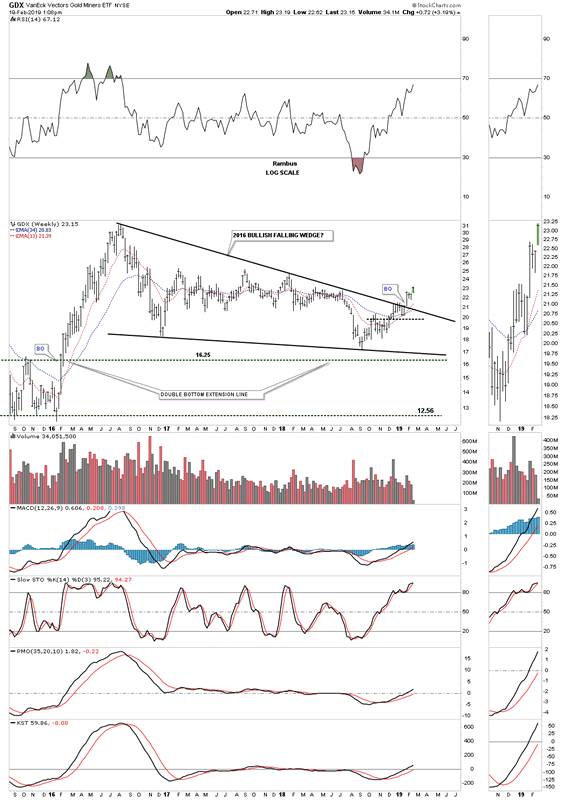
Below is the weekly chart for the GDX which shows the breakout starting to gaining some momentum.

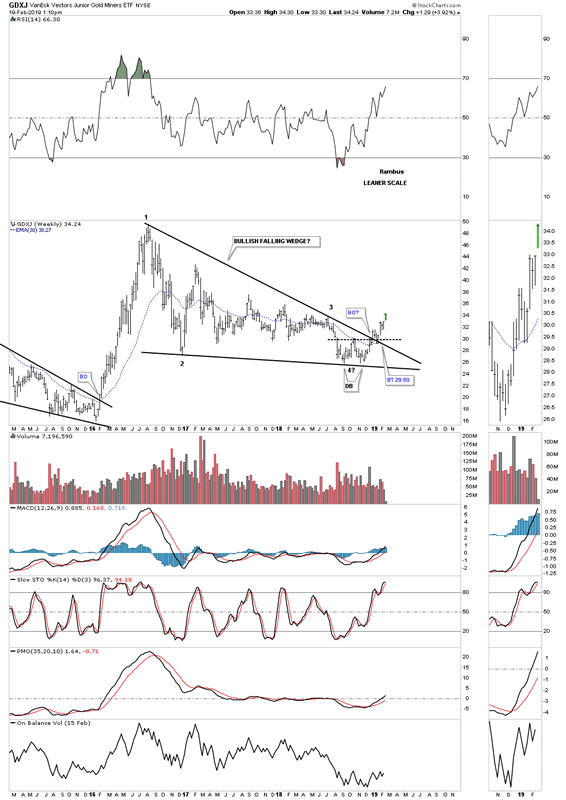
Below is the weekly chart for the GDXJ which shows all systems go.
I will be out of the office this afternoon and probably won’t make it back before the close. It’s been a long time coming so enjoy this day as there will be many more to come. It’s just getting started.

All the best
By Rambus Chartology
FREE TRIAL - http://rambus1.com/?page_id=10
© 2019 Copyright Rambus- All Rights Reserved
Disclaimer: The above is a matter of opinion provided for general information purposes only and is not intended as investment advice. Information and analysis above are derived from sources and utilising methods believed to be reliable, but we cannot accept responsibility for any losses you may incur as a result of this analysis. Individuals should consult with their personal financial advisors.
© 2005-2022 http://www.MarketOracle.co.uk - The Market Oracle is a FREE Daily Financial Markets Analysis & Forecasting online publication.


