Gold Technical Perspective – Why So Bullish?
Commodities /
Gold & Silver 2019
Feb 21, 2019 - 09:04 AM GMT
By: Kelsey_Williams

 Does technical analysis need to be so convoluted? Here are a couple of definitions from different sources:
1) Convoluted: (especially of an argument, story, or sentence) extremely complex and difficult to follow. (source)
2) Convoluted sentences, explanations, arguments, etc. are unreasonably long and difficult to understand.
We are not talking about the accuracy or relevancy; or even the general length of an article centered around charts and graphs. But the convolution of most technical analysis does provoke some head scratching.
Another concern might be the nearly universal use of extrapolation.
1) Extrapolation: the action of estimating or concluding something by assuming that existing trends will continue or a current method will remain applicable.
2) Extrapolate: to infer or estimate by extending or projecting known information.
Judicious use of extrapolation is warranted. However, the inference of trend continuation can lead to predictions and expectations of little foundation or merit.
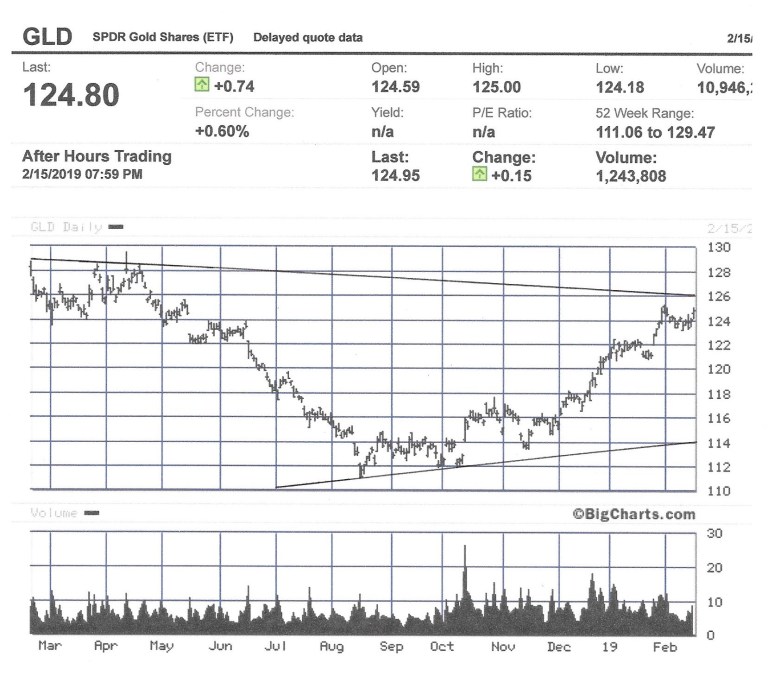
In this article we will look at three charts (one-year, five-year, and ten-year) of GLD, the SPDR Gold Shares ETF. (
source for all charts)
In order to emphasize simplicity and consistency, I have drawn only two lines on each chart – a rising uptrend line of support; and a descending overhead line of resistance. All three charts are updated as of Friday, February 15th, 2019.
Immediately below is the first chart, a one-year history of daily GLD prices…
From this chart we can see that GLD has worked its way higher since its recent low last August. And it appears that it soon may intersect/test overhead resistance at 126. If it does break through and move higher, most observers would probably think that doing so would signal much higher prices.
That seems reasonable, but how high? And what about the downside risk? If it doesn’t break through soon, it could fall back to its rising uptrend line of support. Currently, that is a drop of about eight percent to 114.
Is there enough upside potential to offset the downside risk by an acceptable margin?
While there is nothing overtly negative in the chart pattern, there is also nothing obviously positive, either; at least to a degree that would warrant excessive bullish optimism.
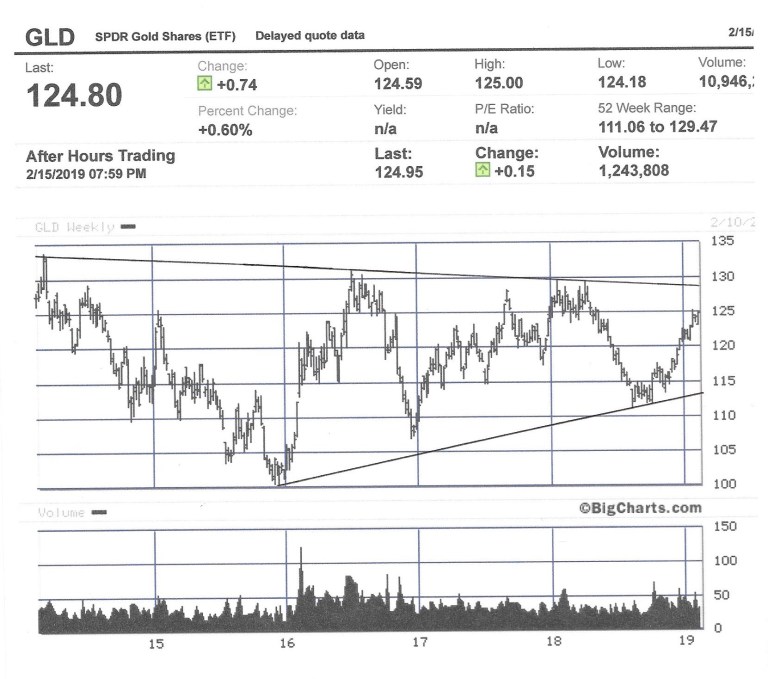
So, lets look at the next chart, a five-year weekly history of prices for GLD…
On this chart we see that there is a descending line of overhead resistance dating back to at
least February 2014. And the rising uptrend line of support dates back to December 2015.
The longer time periods in both cases are indications of strength. This means that the overhead line of resistance we talked about before willprobably not be broken too easily. And maybe not right away. It has turned back at least three previous attempts in the past three years.
But it also means that the uptrend in place for the past five years cannot be taken lightly, and could provide strong support on any pullback.
So where does that leave us? Is there sufficient technical justification to support wildly bullish claims for new highs in gold prices this year? Next year?
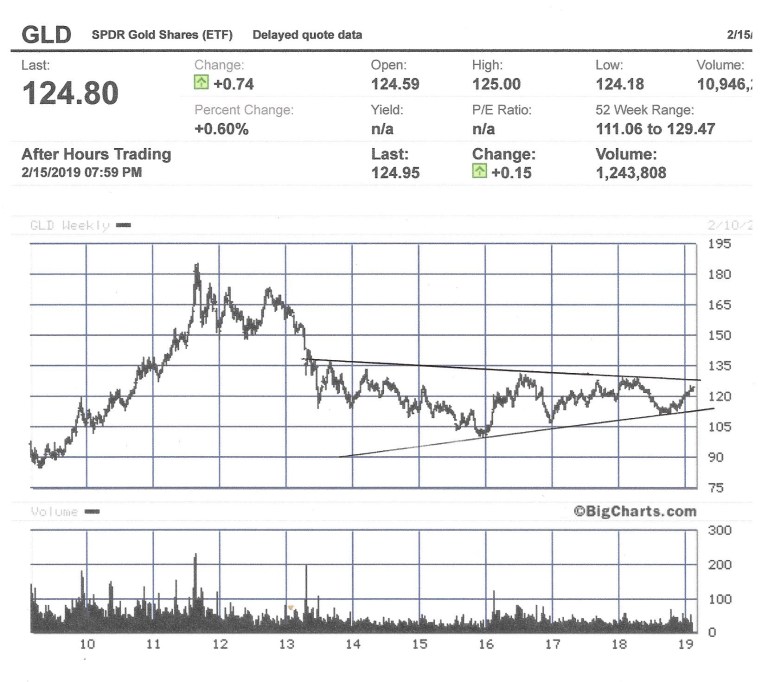
Our final chart just below is a ten-year history of monthly prices for GLD…
From this chart we get an entirely different perspective about gold prices. The rising line of support which has been in place for three years is seen within the context of declining line of overhead resistance which goes back almost six years.
In addition, it is apparent that the two lines will soon intersect; and that the price of GLD will eventually cross at least one of those lines. But which one?
If it is the line of overhead resistance, then that would seem to indicate that recent strength in the price of GLD is the foundation for considerably higher prices.
But the risk on the downside is still significant. Possibly much more than most recognize.
It took twenty-eight years for gold to finally surpass its 1980 price peak of $850.00 per ounce. We are now in the eighth year of declining prices for gold. Can you wait twenty more years to see $1900.00 gold again?
By Kelsey Williams
http://www.kelseywilliamsgold.com
Kelsey Williams is a retired financial professional living in Southern Utah. His website, Kelsey’s Gold Facts, contains self-authored articles written for the purpose of educating others about Gold within an historical context.
© 2019 Copyright Kelsey Williams - All Rights Reserved Disclaimer: The above is a matter of opinion provided for general information purposes only and is not intended as investment advice. Information and analysis above are derived from sources and utilising methods believed to be reliable, but we cannot accept responsibility for any losses you may incur as a result of this analysis. Individuals should consult with their personal financial advisors.
© 2005-2022 http://www.MarketOracle.co.uk - The Market Oracle is a FREE Daily Financial Markets Analysis & Forecasting online publication.