The Coming Bitcoin Ambush
Currencies / Bitcoin Feb 26, 2019 - 04:25 PM GMTBy: readtheticker
If you are accurate drawing your trading channels you will see this ambush setup on bitcoin.
All charts of bitcoin are in USD terms.
The big boys (and some late to the party) want to accumulate hard to get coins, therefore the only way they can do this is scare them out of the weak hand wallets. Those who brought above $1000 on the way up to $20000. Of course (and lets hope for the bulls) the big boys do not want to break the chart completely and force a panic sell off beyond critical levels of massive support (say BTC $1000 USD).
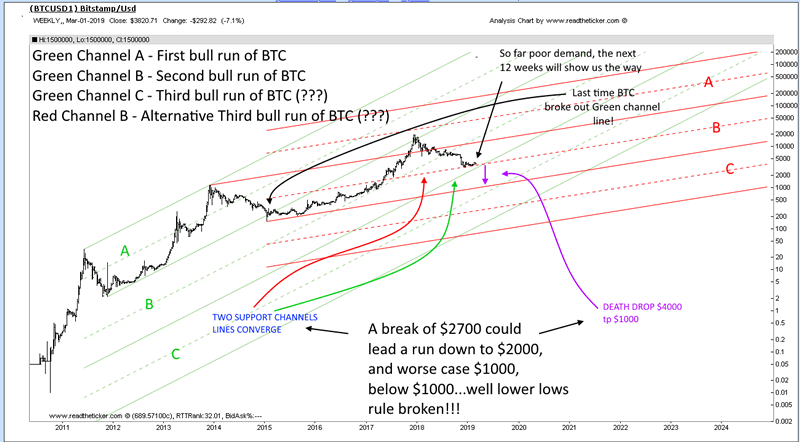
Therefore this most recent pop from $3000 to $4300, we believe, is a bull trap, higher prices to build up shorts and bull disappointment to get price down below $2700 USD. Price nearly always falls down through support from a run down from resistance. Lets face it, bitcoin is thin, it can be pushed around 20% with ease.
A sell off which holds above $1000 is still very bullish. If you are a Elliot Waver, you can see there is more waves to unwind down below $3000 as the selling is not done.
The big channels chart of Bitcoin USD. (Note: Readtheticker draws and holds over time channel objects with ease and great accuracy.)

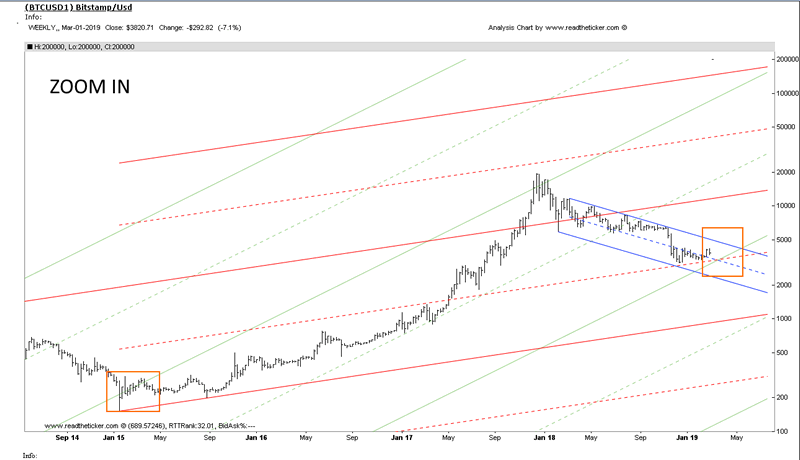
A zoom into the zone of decision.

Fundamentals are important, and so is market timing, here at readtheticker.com we believe a combination of Gann Angles, Cycles, Wyckoff and Ney logic is the best way to secure better timing than most, after all these methods have been used successfully for 70+ years. To help you applying Richard Wyckoff and Richard Ney logic a wealth of knowledge is available via our RTT Plus membership. NOTE: readtheticker.com does allow users to load objects and text on charts, however some annotations are by a free third party image tool named Paint.net Investing
NOTE: readtheticker.com does allow users to load objects and text on charts, however some annotations are by a free third party image tool named Paint.net
Readtheticker
My website: www.readtheticker.com
We are financial market enthusiast using methods expressed by the Gann, Hurst and Wyckoff with a few of our own proprietary tools. Readtheticker.com provides online stock and index charts with commentary. We are not brokers, bankers, financial planners, hedge fund traders or investment advisors, we are private investors
© 2019 Copyright readtheticker - All Rights Reserved
Disclaimer: The material is presented for educational purposes only and may contain errors or omissions and are subject to change without notice. Readtheticker.com (or 'RTT') members and or associates are NOT responsible for any actions you may take on any comments, advice,annotations or advertisement presented in this content. This material is not presented to be a recommendation to buy or sell any financial instrument (including but not limited to stocks, forex, options, bonds or futures, on any exchange in the world) or as 'investment advice'. Readtheticker.com members may have a position in any company or security mentioned herein.
© 2005-2022 http://www.MarketOracle.co.uk - The Market Oracle is a FREE Daily Financial Markets Analysis & Forecasting online publication.


