


NASDAQ and DOW – Two Spectrum’s of the Stock Market
Politics / Stock Markets 2019 Mar 04, 2019 - 04:45 PM GMTBy: Chris_Vermeulen

 Our researchers believe the NQ and YM chart illustrates a very different dynamic which is currently at play in the US Stock Markets. The NQ, the Technology heavy NASDAQ futures, appears to have stalled near the 75% Fibonacci price retracement level whereas the YM, the Blue Chip heavy DOW futures, has already rallied past this level and is setting up a “double top” formation near 26268. It is our belief that the US Stock Markets are already nearing an intermediate top rotation price area and that traders need to actively protect their long trades/profits right away. We believe a downside price rotation may take place very quickly over the next 5~10+ days and that the markets may rotate downward by a minimum of 4~6% in what we are calling a “momentum rotation setup”.
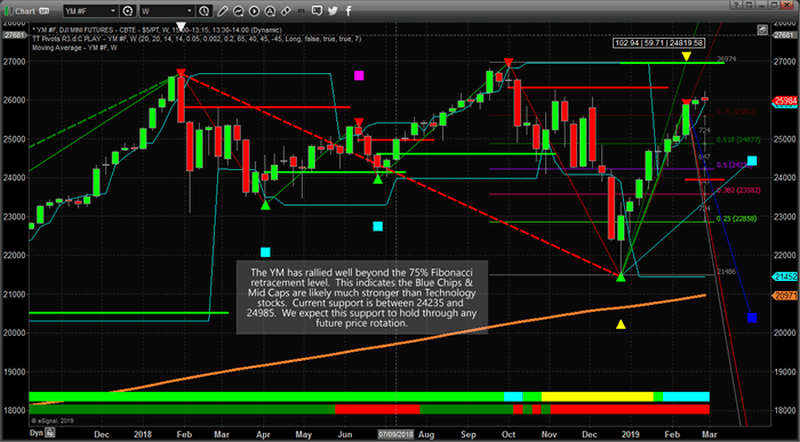
This first chart of the YM on a Weekly charting basis shows how dramatic the upside price move since December 24th has been It also shows the current high prices are very near to the high price levels near the end of November 2018/early December 2018. We believe this “intermediate double top” formation will prompt a downside price rotation towards support near 24985 (or a bit lower). This represents a -5.5% price rotation and will likely frighten a few long traders. It will also embolden the shorts to start to power back into the markets expecting “This is IT! – the Big One”. We believe this downside price rotation will become a very healthy moderate downside price swing that will revalue equity prices, re-establish support and prompt a new upside momentum move that may eventually break all-time highs later this year. In other words, we believe this rotation will be an excellent buying opportunity for skilled traders. We show our volatility VIX setup forming here.
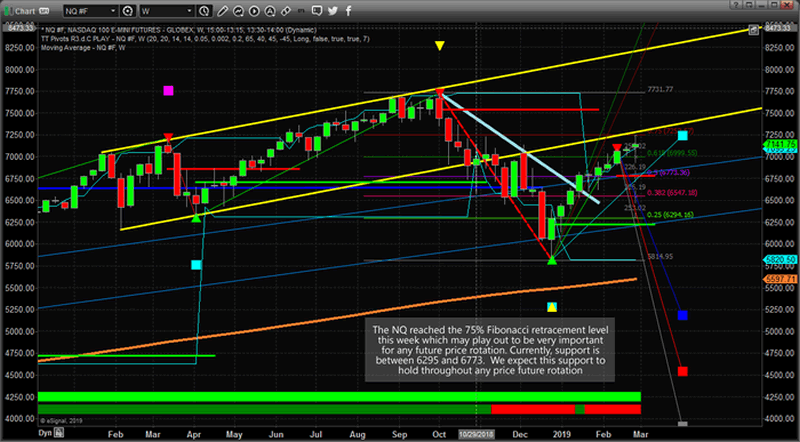
This next NQ, NASDAQ Futures, Weekly chart highlight the dramatic difference between the Blue Chips and the Technology sectors. Unlike the previous upside price swings, between 2016 to early 2018, where the Technology sector was the big gainer, this time it appears the Blue Chips and Mid-Caps are the strongest sectors in this recent move.
We believe this divergence between active price levels may continue through most of 2019 as traders and investors appear to be concerned with technology and the capability of continued earnings/growth going forward. It appears global investors are more likely to move capital into Blue Chips and Mid-Caps because of stronger earning capabilities, dividends and overall strength of price appreciation.
If our prediction of a 4~6% downside price rotation come true, then we believe the Technology sector will likely result in a larger price rotation than the Blue Chips, Mid-Caps & S&P500 sectors. We believe this downside rotation is about to hit the markets currently as the NQ has stalled near the 75% Fibonacci retracement level and our proprietary modeling systems are suggesting a “price anomaly” has setup in the NQ.
Be prepared for a moderately large, -4~6%, downside price rotation over the next 5~15 days where support will likely be found near the -5 to -6% levels for the YM and ES. The NQ may fall a bit further towards 6295 ~ 6773 (-6% to -12%). We believe the weakness in the technology sector will be much greater than the Blue Chips and Mid-Caps.
As skilled traders, we urge you to properly protect your open long positions and prepare for this price rotation. Our team has 53 years of experience in researching and trading makes analyzing the complex and ever-changing financial markets a natural process. We have a simple and highly effective way to provide our customers with the most convenient, accurate, and timely market forecasts available today. Our stock and ETF trading alerts are readily available through our exclusive membership service via email and SMS text. Our newsletter, Technical Trading Mastery book, and 3 Hour Trading Video Course are designed for both traders and investors. Also, some of our strategies have been fully automated for the ultimate trading experience.
Chris Vermeulen
www.TheTechnicalTraders.com
Chris Vermeulen has been involved in the markets since 1997 and is the founder of Technical Traders Ltd. He is an internationally recognized technical analyst, trader, and is the author of the book: 7 Steps to Win With Logic
Through years of research, trading and helping individual traders around the world. He learned that many traders have great trading ideas, but they lack one thing, they struggle to execute trades in a systematic way for consistent results. Chris helps educate traders with a three-hour video course that can change your trading results for the better.
His mission is to help his clients boost their trading performance while reducing market exposure and portfolio volatility.
He is a regular speaker on HoweStreet.com, and the FinancialSurvivorNetwork radio shows. Chris was also featured on the cover of AmalgaTrader Magazine, and contributes articles to several leading financial hubs like MarketOracle.co.uk
Disclaimer: Nothing in this report should be construed as a solicitation to buy or sell any securities mentioned. Technical Traders Ltd., its owners and the author of this report are not registered broker-dealers or financial advisors. Before investing in any securities, you should consult with your financial advisor and a registered broker-dealer. Never make an investment based solely on what you read in an online or printed report, including this report, especially if the investment involves a small, thinly-traded company that isn’t well known. Technical Traders Ltd. and the author of this report has been paid by Cardiff Energy Corp. In addition, the author owns shares of Cardiff Energy Corp. and would also benefit from volume and price appreciation of its stock. The information provided here within should not be construed as a financial analysis but rather as an advertisement. The author’s views and opinions regarding the companies featured in reports are his own views and are based on information that he has researched independently and has received, which the author assumes to be reliable. Technical Traders Ltd. and the author of this report do not guarantee the accuracy, completeness, or usefulness of any content of this report, nor its fitness for any particular purpose. Lastly, the author does not guarantee that any of the companies mentioned in the reports will perform as expected, and any comparisons made to other companies may not be valid or come into effect.
Chris Vermeulen Archive |
© 2005-2022 http://www.MarketOracle.co.uk - The Market Oracle is a FREE Daily Financial Markets Analysis & Forecasting online publication.