


ZN_F Elliott Wave Analysis, USDJPY and SPX
Stock-Markets / Elliott Wave Theory Mar 27, 2019 - 07:28 PM GMT

ZN_F has rallied throughout March so in this video blog, we will take a look at the Technical outlook for ZN_F (US 10 Year Note Futures), present Elliott wave count and also correlate it with USDJPY and $SPX to explain to readers and viewers how it could impact the Yen and $SPX.
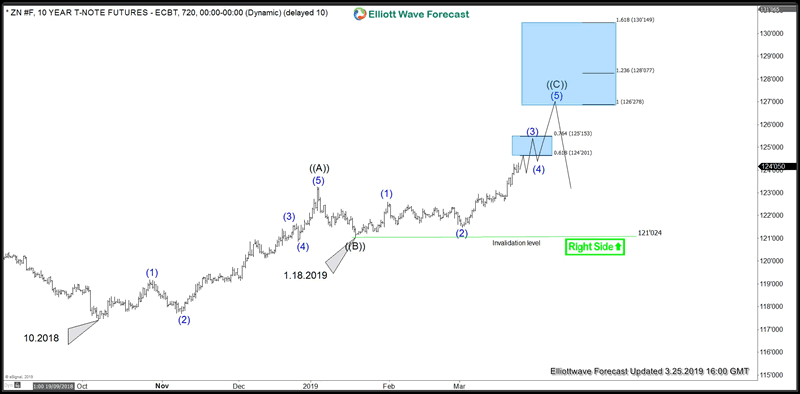
ZN_F Elliott Wave Analysis since 10.2018 low
Rally from October 2018 low is proposed to be taking the form of a Zigzag Elliott Wave Structure when rally to 119’6 completed wave (1), dip to 117’22 completed wave (2), rally to 121’20 completed wave (3), pull back to 120’28 completed wave (4) and move to 123’08 completed wave (5) of wave ((A)) impulse. This was followed by a 3 waves pull back to 121’02 which completed wave ((B)) and we have already seen a new high above 123’08 which suggests wave ((C)) higher is in progress, it has a measured move target of 126’27 – 128’07 and in extension 130’14. Pull backs should remain supported and find buyers in the sequence of 3, 7 or 11 swings as far as pivot at 121’15 i.e. wave (2) of ((C)) low remains intact. While below 130’14, it’s a 3 waves move. However, a break above 130’14 would suggest rally from 121’02 is actually wave ((3)) and not wave ((C)) and would result in more upward extension.
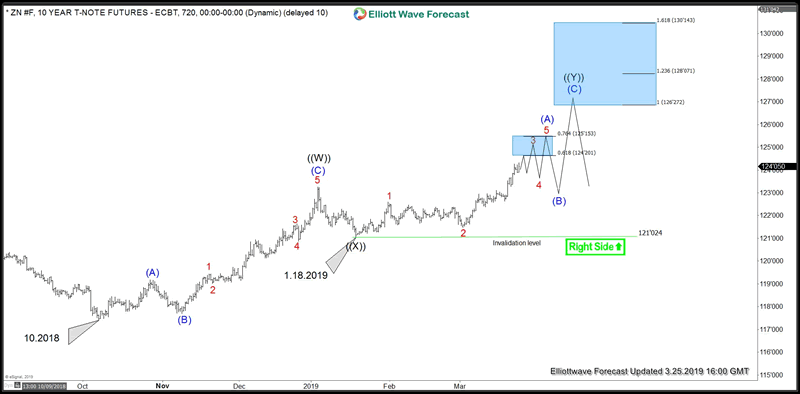
ZN_F Elliott Wave Analysis – Alternate View
This view suggests rally from October 2018 low would unfold as a double three Elliott Wave structure rather than a zigzag but would have the same end result and same measured move target area as far as January 18, 2019 low remains in place. This would allow for a deeper pull back from the first blue box area i.e. 124’20 – 125’15 before rally continues. Wave (B) should offer a buying opportunity in the sequence of 3, 7 or 11 swings if this view plays out.
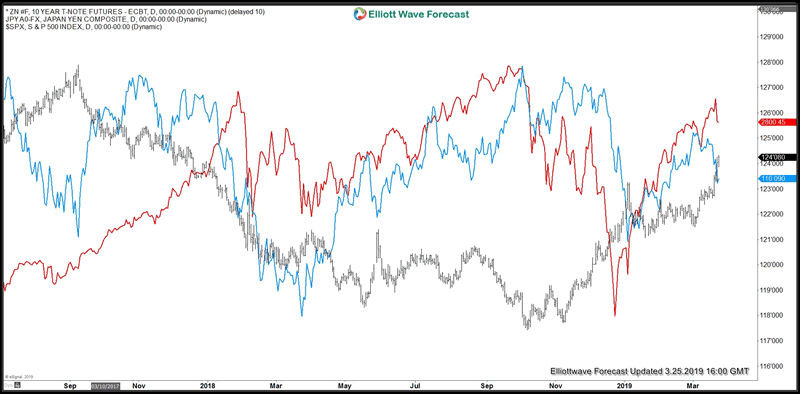
ZN_F Correlation with USDJPY and SPX
Correlation suggests that until ZN_F doesn’t reach 126’27 – 128’07, USDJPY and SPX should either drop or remain sideways – lower. Another high in SPX can’t be ruled out during a pull back of ZN_F but any strength from current levels should be limited and we should soon see a roll over in SPX and other Indices as well.
Thanks for looking. Feel free to come visit our website and check out our services Free for 14 days to see if we can be of help.
Kind regards & good luck trading.
By Daud Bhatti
https://elliottwave-forecast.com
ElliottWave-Forecast has built its reputation on accurate technical analysis and a winning attitude. By successfully incorporating the Elliott Wave Theory with Market Correlation, Cycles, Proprietary Pivot System, we provide precise forecasts with up-to-date analysis for 52 instruments including Forex majors & crosses, Commodities and a number of Equity Indices from around the World. Our clients also have immediate access to our proprietary Actionable Trade Setups, Market Overview, 1 Hour, 4 Hour, Daily & Weekly Wave Counts. Weekend Webinar, Live Screen Sharing Sessions, Daily Technical Videos, Elliott Wave Setup .
Copyright © 2019 ElliottWave-Forecast - All Rights Reserved Disclaimer: The above is a matter of opinion provided for general information purposes only and is not intended as investment advice. Information and analysis above are derived from sources and utilising methods believed to be reliable, but we cannot accept responsibility for any losses you may incur as a result of this analysis. Individuals should consult with their personal financial advisors.
© 2005-2022 http://www.MarketOracle.co.uk - The Market Oracle is a FREE Daily Financial Markets Analysis & Forecasting online publication.