


Fed Inflation Is Losing Its Intended Effect
Economics / Inflation Mar 28, 2019 - 05:24 PM GMTBy: Kelsey_Williams

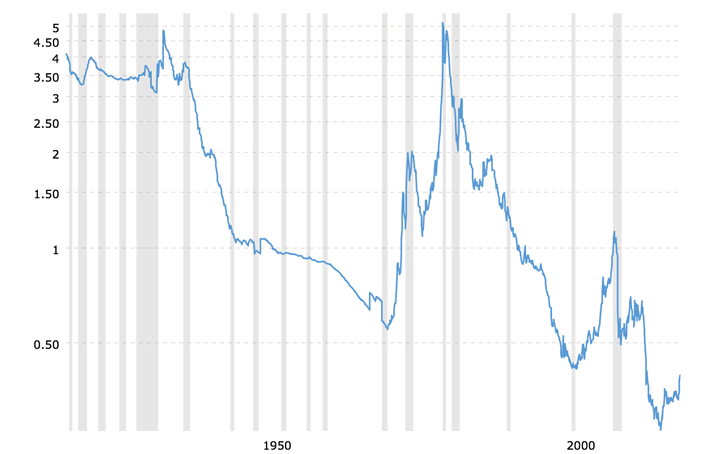
 The chart below shows the ratio of the gold price to the monetary base for the past one hundred years. The monetary base used in the chart is calculated by the St. Louis Federal Reserve and the following definition is from their website:
“The Adjusted Monetary Base is the sum of currency (including coin) in circulation outside Federal Reserve Banks and the U.S. Treasury, plus deposits held by depository institutions at Federal Reserve Banks. These data are adjusted for the effects of changes in statutory reserve requirements on the quantity of base money held by depositories.” (source)
Gold to Monetary Base Ratio (source)
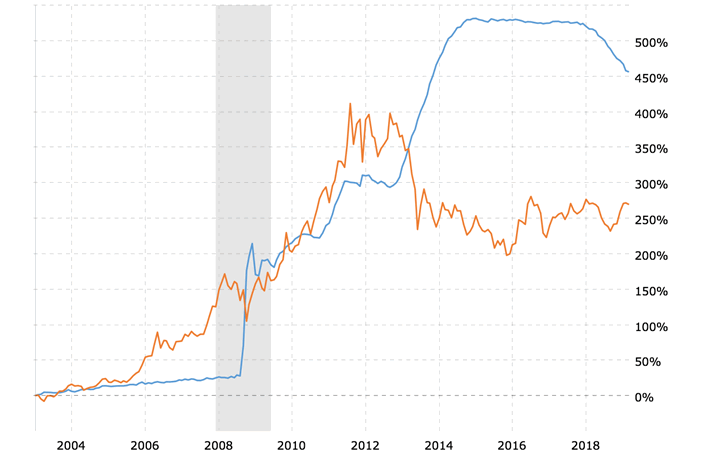
The adjusted monetary base roughly matches the size of the Federal Reserve balance sheet. The chart below depicts the monthly percentage growth of the actual Federal Reserve balance sheet (U.S. Treasuries and Agency mortgage-backed securities) compared to the price of gold for the past fifteen years.
Fed Balance Sheet vs Gold Price (source)
When the Fed purchases debt securities (Treasuries, mortgage-backed securities, etc) in the open market, it credits the account of the seller (one of the Fed’s primary dealers) of the securities with an amount of money equal to the dollar amount of the debt securities purchased.
This new money created by the Fed, in exchange for the debt securities purchased, enters the system and increases the monetary base. The rise in the monetary base is reflected by the corresponding rise in the size of the Fed’s balance sheet.
The procedure is similar to that used by the Fed to monetize the original issuance of bonds, notes, and bills by the U.S. Treasury. From my article “How Government Causes Inflation“:
“The U.S. Treasury, in conjunction with the Federal Reserve, continually expands the supply of money and credit by issuing Treasury Bonds, Notes, and Bills.
The Federal Reserve receives the newly certified Treasury securities and then issues a credit to the U.S. Treasury reflecting the corresponding dollar amount.
The U.S. Treasury proceeds to spend the new funds which it has received from the Federal Reserve…”
In both scenarios, the action by the Federal Reserve is exactly how inflation is created. The money used for the purchase of the securities in both scenarios was created by the Federal Reserve out of nothing.
The definition of inflation is simple and clear: INFLATION IS THE DEBASEMENT OF MONEY BY GOVERNMENT.
In the first chart, we see that the ratio of gold’s price to the monetary base is in a long-term decline that has lasted for over one hundred years. This seems somewhat contradictory when compared to what we know about gold.
Gold’s higher price over time is a reflection of the ongoing decline of the U.S. dollar. The decline (loss of purchasing power) in the value of the U.S. dollar is the result of the inflation created by the government and the Federal Reserve.
The increase in the monetary base is an indicator of the extent to which the government and the Fed have debased the money supply. The continual expansion of the supply of money and credit leads to the loss in purchasing power of the dollar.
Some gold analysts and investors believe that increases in the monetary base lead to similarly proportionate increases in gold’s price. But that is not what is happening.
Gold’s price for the past one hundred years does not correlate with the increase in the monetary base. The price of gold reflects the actual loss in purchasing power of the U.S. dollar.
A century ago, the price of gold was $20.67 per ounce. Today’s current price is sixty-four times greater at close to $1320.00 per ounce. This represents a decline in the U.S. dollar’s value of more than ninety-eight percent (98.5) over the past one hundred years.
It takes more than sixty times as many dollars today to buy what one could buy one hundred years ago. Another way to say the same thing is that today’s dollar is worth only one and one-half cents compared to 1919.
So why does not the U.S. dollar’s decline more closely align with the infinitely larger increase in the monetary base? After all, the thought of all that money sloshing around should take prices for gold much higher and the dollar much lower.
This is the logic that helped fuel the move in gold’s price between 2000-11. But even at gold’s all-time high of close to $1900.00 per ounce in August 2011, the ratio of gold’s price to the monetary base stood at just a bit more than 1.00, which is only twenty percent as high as its peak of close to 5.00 in 1980.
As shown on the second chart (Fed’s balance sheet versus gold prices), gold’s price surge after the Fed announced and began their QE efforts in 2008, seemed to confirm the expectations of investors that exponentially higher gold prices would follow. They did not.
One of the reasons for the apparent disconnect between gold’s price and the monetary base is due to the assumption that the price of gold will respond in mathematical proportion to the increases in the monetary base. It has not done so since gold’s high in 1980.
One of the reasons is that the assumption itself is not valid. Gold’s price represents the dollar’s actual change in value, not changes in the monetary base, or money supply.
It is true that continual increases in the monetary base can lead to an eventual loss of purchasing power of the dollar. But that loss is the sum of what has already transpired, and is also affected by people’s perception of the actual damage that has been done, as well as what might happen in the future. Sentiment and confidence – or lack of it – are factors, too.
The major part of money creation by the Federal Reserve is credit-based. In addition, the ongoing results of our fractional-reserve banking system complicate and confound anyone who thinks there is a practical way to predict the effects of the inflation that has been created.
The inflation (expansion of the supply of money and credit) produced by the Federal Reserve is deliberate and intentional. And ongoing. The effects of that inflation are volatile and unpredictable.
But there is another thing these charts might be telling us.
Regardless of whether or not the Fed knows what they are doing, there is one thing in particular that explains why increases in the monetary base don’t result in corresponding increases in gold’s price.
Inflation created by the Fed is losing its intended effect. It’s resulting effects on the economy are similar to those of drug addiction. Over time, each subsequent fix yields less and less of the desired results.
With all of the intended impact that was expected as a result of quantitive easing, our country’s economy barely dodged a bullet – temporarily.
With all of the trillions of dollars of credit that were created ‘magically’ by the Fed in response to the events of 2007-08, why did things not get better more quickly and more obviously? And why did things not improve as much economically, rather than just from the spillover effects of higher prices for financial assets?
If we didn’t experience anything close to the runaway inflation that some expected and predicted ten years ago, why should we expect it now?
Further, why should we expect better results this time from a Federal Reserve that has pretty much lost control of a sinking ship?
By Kelsey Williams
http://www.kelseywilliamsgold.com
Kelsey Williams is a retired financial professional living in Southern Utah. His website, Kelsey’s Gold Facts, contains self-authored articles written for the purpose of educating others about Gold within an historical context.
© 2019 Copyright Kelsey Williams - All Rights Reserved Disclaimer: The above is a matter of opinion provided for general information purposes only and is not intended as investment advice. Information and analysis above are derived from sources and utilising methods believed to be reliable, but we cannot accept responsibility for any losses you may incur as a result of this analysis. Individuals should consult with their personal financial advisors.
© 2005-2022 http://www.MarketOracle.co.uk - The Market Oracle is a FREE Daily Financial Markets Analysis & Forecasting online publication.