Silver’s Next Big Move
Commodities / Gold & Silver 2019 Apr 24, 2019 - 09:41 AM GMTBy: Kelsey_Williams
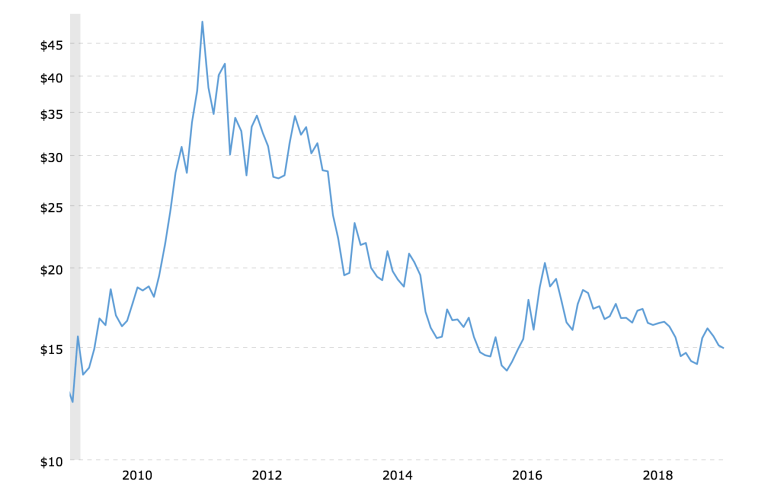
Eight years ago this month, silver started its “next big move”. And that move continues today. It is awesome to behold. See the chart (ten-year history of silver prices) below…

After an intraday peak price spike to $49.82, silver has tumbled head first down the mountain slope to its current level of just under fifteen dollars per ounce, at $14.98. That represents a cumulative decline of seventy percent, which is awfully bad.
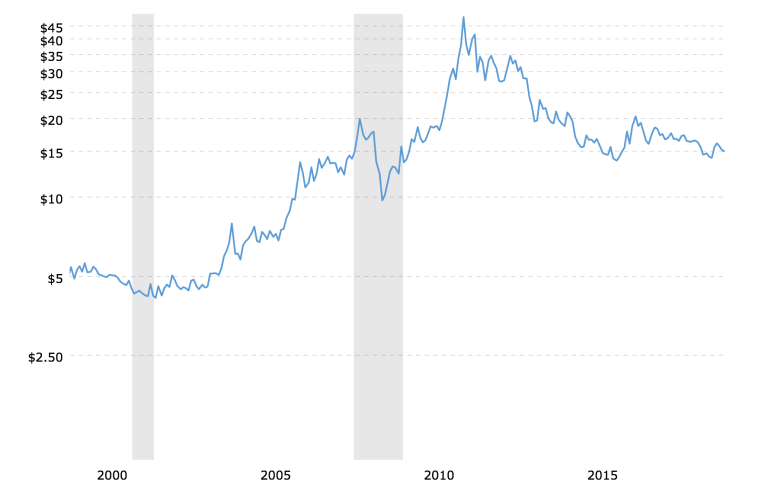
But in order to put things in perspective, we need to go further back in time. Below is another chart. This one shows the silver price for the past twenty years…

This second chart provides a different perspective of silver’s price action over the past eight years.
Here we see that the current seventy percent decline in silver’s price came on the heels of a one thousand one hundred fifty percent increase beginning in late 2001 and ending with the price spike we mentioned earlier that took silver to almost fifty dollars per ounce.
While I haven’t drawn it in, there is a long-term uptrend line dating back to November 2001 that is still intact. Silver could actually fall back to somewhere close to $10.00 per ounce in the near term without breaking the trend line.
The prospect of silver under $11.00 per ounce may not thrill those who are über bullish, but the uptrend line still provides possible technical support for the beleaguered metal. It also might be a source of hope for those analysts and investors who seem to always be defending their bullish expectations.
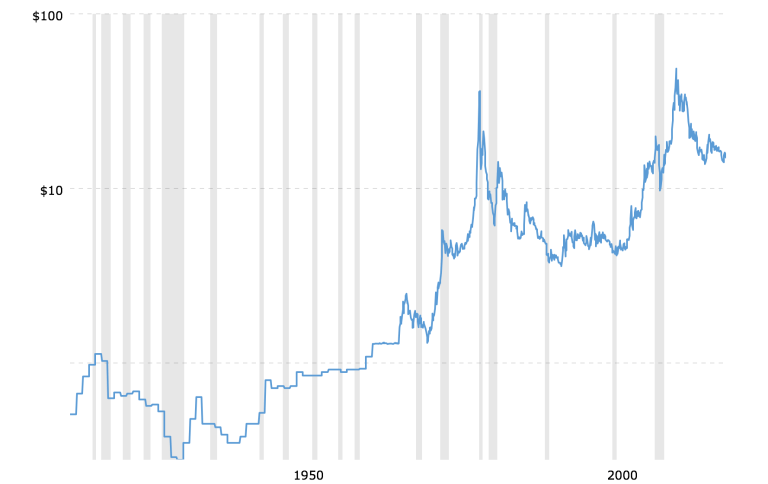
We still need to know more, though, before we can proclaim that all is well with silver. Below is a third chart of silver, which shows a one hundred year history of the white metal…

In this chart, there is also a long-term uptrend line. This one dates back to December 1941. It, too, provides a possible floor under silver’s price of somewhere close to $10.00 per ounce.
There is also another, longer, uptrend line dating back to 1932, when silver was priced at $.28 per ounce. A possible intersection point for that trend line, within the next year or so, is at $2.50 per ounce.
I don’t think any investors would be buoyed by the thought that a nearly ninety-year uptrend in the price of silver was still in force if they were looking at silver under $3.00 per ounce.
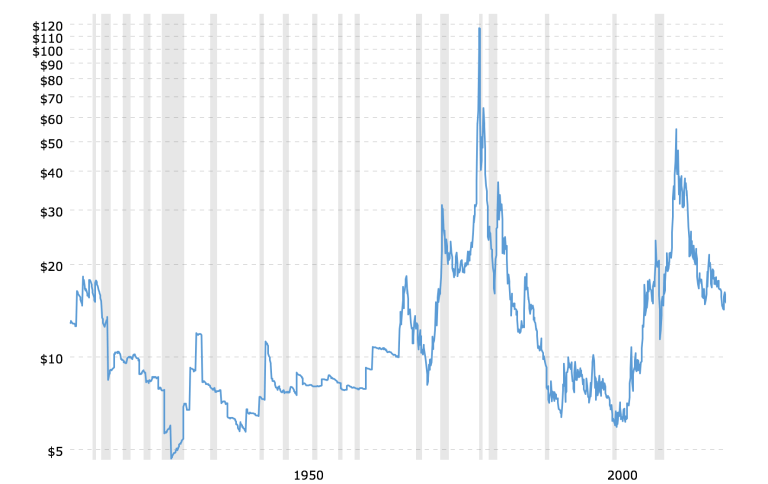
And that’s the good news. Here is a fourth chart which plots the price of silver over the past one hundred years on an inflation-adjusted basis.

Using silver’s intraday peak in 1980 of just over $50.00 per ounce (inflation-adjusted price $160.00 per ounce), and comparing it to today’s price of $14.98 per ounce, silver has declined by ninety percent over the past four decades (thirty-nine years).
Silver is cheaper today than it was a century ago. What’s more, in April 1919, exactly one hundred years ago, silver began a two-year decline that cleaved its price nearly in half. Can you imagine silver today at $8.00 per ounce?
Some say that silver at $15.00 per ounce is a bargain. Actually, they are a little more exuberant than that. Often we hear “It’s a screaming buy!” Why?
There are no fundamentals or technical factors to support such claims.
Can silver suddenly spike upwards from here, say to $20.00 per ounce? Sure, but whenever silver has done anything similar in the past (and not very often) it always comes back down to earth.
Maybe, with lots of help and lots of luck, you might catch the fast train. Just remember to get off at the first stop.
(see also Gold-Silver Ratio: Debunking The Myth and Silver Fails Miserably to Meet Expectations)
Kelsey Williams is the author of two books: INFLATION, WHAT IT IS, WHAT IT ISN’T, AND WHO’S RESPONSIBLE FOR IT and ALL HAIL THE FED!
By Kelsey Williams
http://www.kelseywilliamsgold.com
Kelsey Williams is a retired financial professional living in Southern Utah. His website, Kelsey’s Gold Facts, contains self-authored articles written for the purpose of educating others about Gold within an historical context.
© 2019 Copyright Kelsey Williams - All Rights Reserved Disclaimer: The above is a matter of opinion provided for general information purposes only and is not intended as investment advice. Information and analysis above are derived from sources and utilising methods believed to be reliable, but we cannot accept responsibility for any losses you may incur as a result of this analysis. Individuals should consult with their personal financial advisors.
© 2005-2022 http://www.MarketOracle.co.uk - The Market Oracle is a FREE Daily Financial Markets Analysis & Forecasting online publication.


