When Will the Stock Market’s Rally Stop?
Stock-Markets / Stock Markets 2019 May 07, 2019 - 09:41 AM GMTBy: Troy_Bombardia
 The stock market managed to squeak out some additional gains this week, and the S&P is now up 15 of the past 19 weeks. A lot of traders are probably wondering “when will the stock market’s rally end?”
The economy’s fundamentals determine the stock market’s medium-long term outlook. Technicals determine the stock market’s short-medium term outlook. Here’s why:
- The stock market’s long term risk:reward is no longer bullish.
- The medium term direction (e.g. next 6-12 months) has a bullish lean.
- The stock market’s short term leans bearish

We focus on the long term and the medium term.
Long Term
While the bull market could keep going on, the long term risk:reward no longer favors bulls. Towards the end of a bull market, risk:reward is more important than the stock market’s most probable direction over the next 12+ months
A few leading indicators are showing signs of deterioration. The usual chain of events looks like this:
- Housing – the earliest leading indicators – starts to deteriorate. This has occurred already, but is not significant
- The labor market starts to deteriorate. Meanwhile, the U.S. stock market is in a long term topping process. The labor markets have not deteriorated significantly yet.
- Other economic indicators start to deteriorate. The bull market is definitely over, and a recession has started. A U.S. recession is not imminent right now
Valuations
The stock market’s valuations are high, as they have been for years. But valuations alone do not cause bear markets. Recessions cause bear markets. A recession is like jumping out of the building, and valuations are like the floor from which you jump out. Jumping out of the building causes the damage, the floor from which you jump out determines how much damage.
- High valuations + recession = big bear market
- Low valuations + recession = big correction
Here’s the Shiller P/E ratio, from Quandl

Here’s Tobin’s Q, from Advisor Perspectives.

Housing
There continues to be some weakness in the in the housing market, although this weakness is not significant. Watch out if housing improves over the next few months, which will eliminate the “housing is deteriorating” narrative.

You can see that while NAHB Homebuilder Sentiment is trending downwards, in recent months it has gone up a little. If Homebuilder Sentiment and other housing indicators continue to trend higher for a few more months, then we will need to re-evaluate the “housing is deteriorating” narrative. Be flexible and change with the data.
With Housing Starts slowing down (as we mentioned last week), the year-over-year % change in Residential Construction spending has fallen. This indicator is not perfect, as the historical data is limited and there were false signals in the past (1995).

Labor market
Initial Claims and Continued Claims are both trending sideways.


In the past, these 2 figures trended higher before bear markets and recessions began.


Meanwhile, the Unemployment Rate made a new low for this economic expansion. The Unemployment Rate isn’t as useful as Initial Claims and Continued Claims. Initial Claims and Continued Claims tend to lead the Unemployment Rate, which is more of a coincident economic indicator.

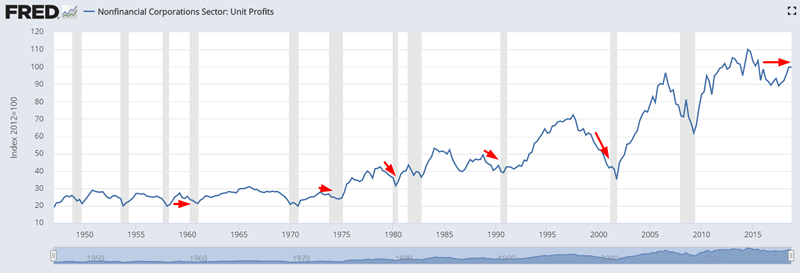
Unit Profits
Unit Profits is trending sideways. This is a typical late-cycle sign for the stock market and economy. In the past, Unit Profits trended sideways or downwards for several years before bull markets and economic expansions ended.

Hours of Production
The year-over-year % change in hours of production worked has fallen to the lowest level since 2008.

This reflects the overall slowdown in Industrial Production: manufacturing.

While the decline in hours of production worked is not a good sign for the economy, it should not be treated in isolation. This is just a weak point in an overall improving economy. Moreover, manufacturing indicators are not as important as housing and labor market indicators because the U.S. is not a manufacturing-centric economy.
ISM PMI
The latest reading for ISM PMI fell from its previous reading. However, the key point is that ISM is still above 50, which signals expansion. This is merely a slowdown in the rate of growth, which you can see happens all the time. A reading below 50 would be more worrisome than a slowdown in the rate-of-growth.

Moreover, the recent “divergence” between the S&P and ISM is not unprecedented.

Here’s what happens next to the S&P when ISM PMI falls more than -1% over the past 4 months while the S&P rallies more than +15%.

Conclusion: The stock market’s biggest long term problem right now is that as the economy reaches “as good as it gets”, the long term risk on the downside is much greater than the long term reward on the upside.
The end of a bull market is always very tricky to trade. The stock market can go up a lot in its final year, even if the macro economy is deteriorating (e.g. 2006-2007). That’s why it’s better to focus on long term risk:reward instead of trying to time exact tops and bottoms. Even when you think the top is in, the stock market could very well surge for 1 more year. (Just ask the people who thought that the dot-com bubble would end in 1998. It lasted another 1.5 years).
Medium Term
*For reference, here’s the random probability of the U.S. stock market going up on any given day, week, or month.

The stock market’s technicals demonstrate a bullish lean over the next 6-12 months.
TIME
The NASDAQ is now up 17 of the past 19 weeks.
From 1971 – present, this has only happened 3 other times:
- February 2000: bull market top
- July 1989: recession and big correction 1 year later
- April 1972: bull market top 9 months later

*Sample size is small, so take this with a grain of salt.
Magnitude
The S&P’s 19 week rate-of-change (since the December 2018 bottom) is at +21%

While the stock market does “eventually” make a correction, similar historical cases were near universally bullish for the S&P 6-12 months later.

Trend
The stock market’s short term trend has gone up non-stop. The S&P’s 20 day moving average is now up 76 days in a row

While these uptrends end sooner or later (mostly sooner), they have been mostly bullish for the S&P 6-12 months later from 1950 – present.

But if you include the pre-1950 data, you can see that this isn’t as bullish.

“Divergences”
On paper it “looks like” the NYSE Composite has diverged from the S&P.

Except these divergences have occurred quite frequently over the past 20 years, and have not been consistently bearish for the S&P.


The reason why the NYSE Composite has “diverged” from the S&P is because more and more foreign stocks are included in the NYSE Composite. The NYSE Composite no longer best represents the U.S. stock market. Over the past 2 years, foreign stock markets have significantly underperformed the U.S.

Meanwhile, interest rates are still not going up, which supposedly implies that “credit markets don’t believe in the bullish narrative in stocks”.

Here’s every case in which the S&P rallied more than +20% in the past 19 weeks, while the 2 year Treasury yield fell at least -0.3%

Clearly the credit markets dont need to “believe in the bullish narrative in stocks”.
Breadth
The NYSE McClellan Summation Index (another popular breadth indicator) has been above 600 for 64 consecutive days. That’s quite the streak of decent breadth.

Similar historical streaks were mostly bullish for the S&P. And the 3 month max drawdowns were mostly shallow, with the largest at -5.6%

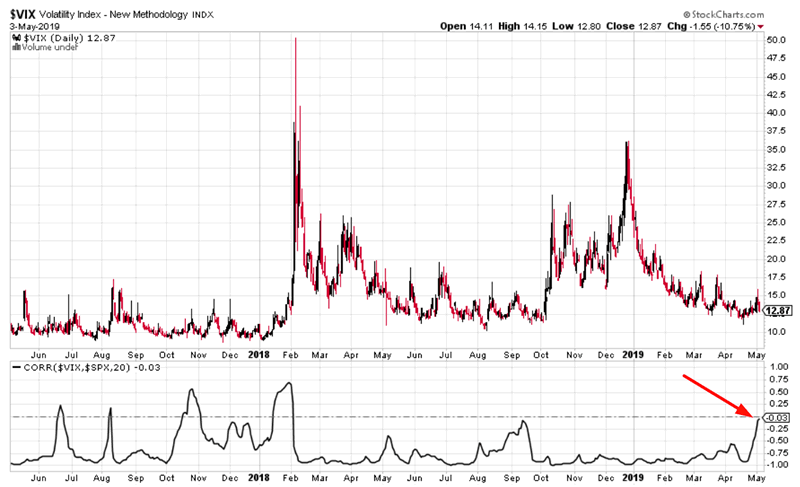
Volatility
VIX and the S&P are both starting to trend higher right now. For example, VIX and the S&P’s 10 day correlation has almost risen to zero.

While this may seem scary (the last time this happened was before the January 2018 vol-maggedon), it’s not. This happens quite often, and is neither consistently bullish nor bearish for stocks.

Correlations
The S&P and oil have had a very strong correlation from September 2018 – present. With oil now falling, their correlation has broken down.

Oil might “lead the S&P down” in the short term, but this is not a long term concern.

Stocks vs Commodities
As the stock market rallies, non-energy commodities continue to languish. Here’s the S&P:CRB ratio (CRB is a commodities index).

The S&P:CRB ratio is more than 10% above its 1 year moving average right now. While the common assumption is “this ratio will mean revert”, that’s not what tends to happen. Stocks often continue to rally and commodities continue to languish over the next 3-12 months.


Sell in May and go Away
And lastly, I would like to examine “Sell in May and go away”
Yes, it’s true that from 1950 – present the 6 months from May – October is much weaker than the 6 months from November – April.

But before 1950, the opposite was true. The stock market was often quite strong during the summer.

This illustrates the foremost problem with seasonality-based market timing. Seasonality changes over the years, and you have no idea when it will change until it has already changed. So think about this before you decide to buy/sell because seasonality is bullish/bearish right now.
Short Term
With the stock market up so much over the past 4+ months, it’s easy to say that the stock market has a short term bearish lean. “Eventually” the stock market will correct and volatility will spike. But we don’t know if that’s tomorrow, next week, next month, or in 3 months. Too many random and exogenous factors impact the stock market’s short term. That’s why we focus on the medium-long term.
We don’t use our discretionary outlook for trading. We use our quantitative trading models because they are end-to-end systems that tell you how to trade ALL THE TIME, even when our discretionary outlook is mixed. When our discretionary outlook conflicts with our models, we always follow our models.
Conclusion
Here is our discretionary market outlook:
- The U.S. stock market’s long term risk:reward is no longer bullish. In a most optimistic scenario, the bull market probably has 1 year left. Long term risk:reward is more important than trying to predict exact tops and bottoms.
- The medium term direction (e.g. next 6-9 months) has a bullish lean.
- We don’t predict the short term because the short term is always extremely random, no matter how much conviction you think you have. Focus on the medium-long term.
Goldman Sachs’ Bull/Bear Indicator demonstrates that risk:reward does favor long term bears.

Members can see exactly how we’re trading the U.S. stock market right now based on our trading models.
Click here for more market analysis
By Troy Bombardia
I’m Troy Bombardia, the author behind BullMarkets.co. I used to run a hedge fund, but closed it due to a major health scare. I am now enjoying life and simply investing/trading my own account. I focus on long term performance and ignore short term performance.
Copyright 2019 © Troy Bombardia - All Rights Reserved
Disclaimer: The above is a matter of opinion provided for general information purposes only and is not intended as investment advice. Information and analysis above are derived from sources and utilising methods believed to be reliable, but we cannot accept responsibility for any losses you may incur as a result of this analysis. Individuals should consult with their personal financial advisors.
© 2005-2022 http://www.MarketOracle.co.uk - The Market Oracle is a FREE Daily Financial Markets Analysis & Forecasting online publication.


