Bitcoin Setting Up For Another Drop
Currencies / Bitcoin May 09, 2019 - 01:18 PM GMTBy: Chris_Vermeulen
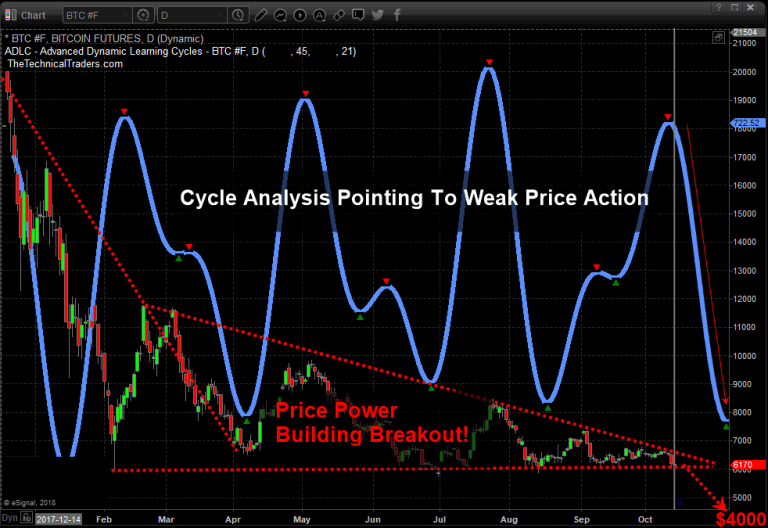
Last year just days before the big Bitcoin breakdown we notified everyone publicly to get ready for a swift drop from $6000 to $4000 which played out perfectly within a few days. Our cycle system and technical analysis skills combined can pack a powerful punch and this one of those incredible moves where the stars aligned for us as traders.
October 12, 2018 – Post and Chart Here

We then further updated our followers in March of this year that a breakout was about to take place and a run to $6000 should take place. After that upside breakout move on April 8th, we posted this video further confirming $5800-$6000 was still the target.
Today/May Bitcoin appears to be setting up a broader top formation that suggests another move lower is about to unfold.
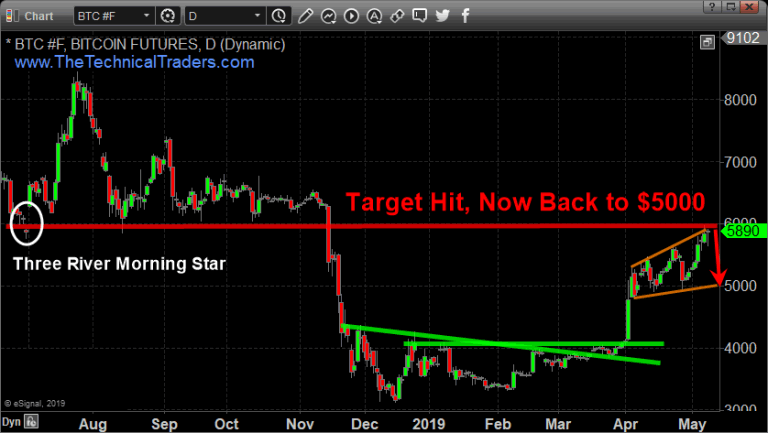
This first Daily chart highlights both support and resistance in Bitcoin. The Resistance goes all the way back to July 2018 where a Three River Morning Star pattern set up a gap with a Doji Star formation. This created the support level that was ultimately broken in November 2018. Support formed near $4000 in early 2019 with similar types of gap formations. This support level was ultimately broken in April 2019 with a move back up to resistance near $6000.

We believe the setup of the most recent price activity is setting up a classic three mountains top formation. A weak price rotation prompting a downside price move right now could be a short term ultimately top with next support near $5000. We believe a fairly quick downside price move toward the $4400 level (or lower) – near support.
Once price move to near the $4400 price level, or lower, if the support level is broken, we could see the price of Bitcoin fall all the way towards the $3500 level or lower. Fibonacci price theory suggests the failed high price move, near $7500, would represent a major failed high. This failure suggests a move lower attempting to establish a new price low. For this to happen, the price of Bitcoin would have to fall below $3000 which may sound crazy, but so was $20,000 bitcoin!
Watch for a reversal to unfold in the coming days, could be another opportunity to profit from another cryptocurrency collapse. Any failure of this breakdown/reversal move would suggest Bitcoin is setting up a new Pennant/Flag formation where the price will trade sideways before prompting a bigger breakout move. We believe a price breakdown is about to unfold and we expect prices to fall below $4400 within 14 to 28 days.
If you want to know when we get long Silver next be sure to join our Wealth Trading Newsletter and get our trading signals. In fact, we are giving away and shipping FREE Silver rounds for select membership levels for the next few days.
Chris Vermeulen
www.TheTechnicalTraders.com
Chris Vermeulen has been involved in the markets since 1997 and is the founder of Technical Traders Ltd. He is an internationally recognized technical analyst, trader, and is the author of the book: 7 Steps to Win With Logic
Through years of research, trading and helping individual traders around the world. He learned that many traders have great trading ideas, but they lack one thing, they struggle to execute trades in a systematic way for consistent results. Chris helps educate traders with a three-hour video course that can change your trading results for the better.
His mission is to help his clients boost their trading performance while reducing market exposure and portfolio volatility.
He is a regular speaker on HoweStreet.com, and the FinancialSurvivorNetwork radio shows. Chris was also featured on the cover of AmalgaTrader Magazine, and contributes articles to several leading financial hubs like MarketOracle.co.uk
Disclaimer: Nothing in this report should be construed as a solicitation to buy or sell any securities mentioned. Technical Traders Ltd., its owners and the author of this report are not registered broker-dealers or financial advisors. Before investing in any securities, you should consult with your financial advisor and a registered broker-dealer. Never make an investment based solely on what you read in an online or printed report, including this report, especially if the investment involves a small, thinly-traded company that isn’t well known. Technical Traders Ltd. and the author of this report has been paid by Cardiff Energy Corp. In addition, the author owns shares of Cardiff Energy Corp. and would also benefit from volume and price appreciation of its stock. The information provided here within should not be construed as a financial analysis but rather as an advertisement. The author’s views and opinions regarding the companies featured in reports are his own views and are based on information that he has researched independently and has received, which the author assumes to be reliable. Technical Traders Ltd. and the author of this report do not guarantee the accuracy, completeness, or usefulness of any content of this report, nor its fitness for any particular purpose. Lastly, the author does not guarantee that any of the companies mentioned in the reports will perform as expected, and any comparisons made to other companies may not be valid or come into effect.
Chris Vermeulen Archive |
© 2005-2022 http://www.MarketOracle.co.uk - The Market Oracle is a FREE Daily Financial Markets Analysis & Forecasting online publication.


