


Technical Analysis Shows Aug/Sept Stock Market Top Pattern Should Form
Stock-Markets / Stock Markets 2019 Jun 12, 2019 - 06:53 AM GMTBy: Chris_Vermeulen

 We have been pouring over the data and currently believe our earlier prediction of a July/August 2019 market top should be revised to an Aug/Sept 2019 expected market top pattern. The following research posts we authored recently suggested a top may form in July/Aug 2019 and believe this critical top formation would form at new all-time highs. We still believe this is possible regarding the price predictions, yet we believe the price top will now form near the end of August or early September after an extended Pennant/Flag formation is completed.
Please review the following research posts by our team…
June 5, 2019: Fear Drives market Expectations: HERE
May 14, 2019: Trade Issues Will Drive Market Trends, Part II: HERE
March 31, 2019: Proprietary Cycles Predict July Turning Point For Stock Market: HERE
Using our proprietary price modeling tools and systems, believe the critical price peak in the US stock market will now happen between August 26 and September 20 (see the chart below). A number of key factors are lining up to extend this topping pattern into August/September and the key component is the formation of the Pennant/Flag formation and the fact that this price pattern must complete before a breakout/breakdown move is possible.
An upside price bias will continue throughout the formation of the Pennant/Flag formation leading to a moderate price breakout where the S&P will briefly break through the $3000 price level, then stall – forming the Top pattern/rotation we are expecting.
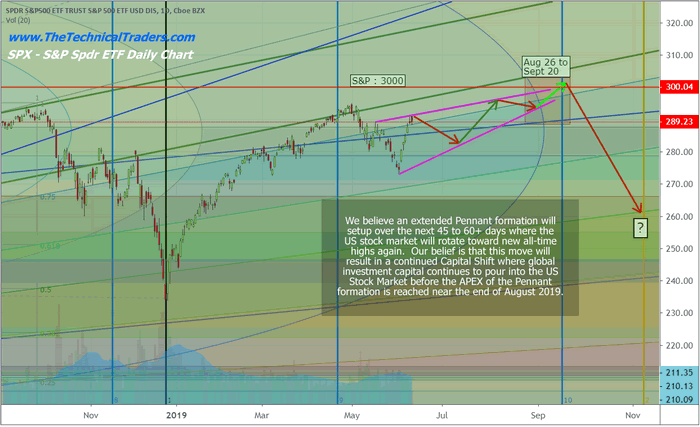
A continued Capital Shift will drive prices higher over the next 45 to 60+ days where foreign capital will continue to chase the strong US Dollar and the strength of the US stock market. The true critical price move, where our analysis will become even more important, happens after September 1, 2019 – where the Pennant Apex and a critical inflection point are set.
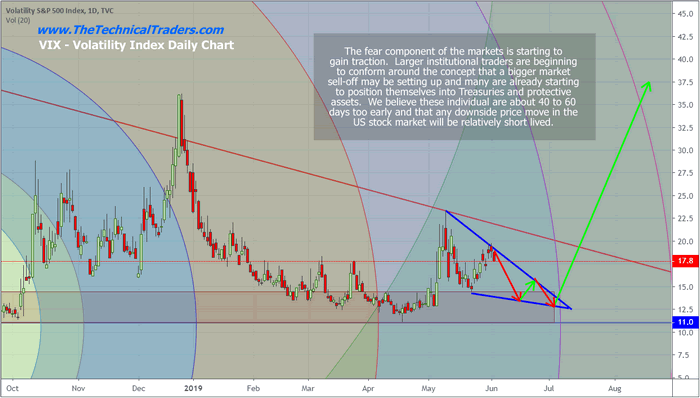
On June 5, 2019, we posted this VIX chart in the article listed above. The US stock market will rotate higher in an upward price bias over the next 45+ days. This will project the Pennant/Flag formation and set up the critical top pattern that we are expecting in late August or early September. When you look at this chart of the VIX, below, consider that the upside price move in the VIX may be delayed by about 10 to 15 days based on our newest analysis. We still believe the VIX expansion will happen as we are suggesting, we are altering the timeline of these predictions to support our newest research.
As we move closer to these critical dates, we’ll keep you informed of our expectations and what new information our predictive modeling systems are suggesting. In the meantime, get ready to play some moderate price swings. Don’t get caught on the short side of this move just yet. We have no real confirmation that a large downside move will take place over the next 60+ days and these early shorts are going to feel a lot of pressure over the next 45 to 60+ days if the market moves higher.
This is one scenario of how the stock market may play out, we have a few others we are following with subscribers to our Wealth Building Newsletter with much more detail. Each day we share a pre-market video and show you where all the major markets are headed for the day, week and month ahead. The analysis is done on the futures market but we focus on trading ETFs for the indexes and commodities.
In fact, there are several super cycles starting to take place as we head into 2020 and beyond which Brad Matheny and layout in our new book: 2020 Cycles – The Greatest Opportunity Of Your Lifetime
Chris Vermeulen
www.TheTechnicalTraders.com
Chris Vermeulen has been involved in the markets since 1997 and is the founder of Technical Traders Ltd. He is an internationally recognized technical analyst, trader, and is the author of the book: 7 Steps to Win With Logic
Through years of research, trading and helping individual traders around the world. He learned that many traders have great trading ideas, but they lack one thing, they struggle to execute trades in a systematic way for consistent results. Chris helps educate traders with a three-hour video course that can change your trading results for the better.
His mission is to help his clients boost their trading performance while reducing market exposure and portfolio volatility.
He is a regular speaker on HoweStreet.com, and the FinancialSurvivorNetwork radio shows. Chris was also featured on the cover of AmalgaTrader Magazine, and contributes articles to several leading financial hubs like MarketOracle.co.uk
Disclaimer: Nothing in this report should be construed as a solicitation to buy or sell any securities mentioned. Technical Traders Ltd., its owners and the author of this report are not registered broker-dealers or financial advisors. Before investing in any securities, you should consult with your financial advisor and a registered broker-dealer. Never make an investment based solely on what you read in an online or printed report, including this report, especially if the investment involves a small, thinly-traded company that isn’t well known. Technical Traders Ltd. and the author of this report has been paid by Cardiff Energy Corp. In addition, the author owns shares of Cardiff Energy Corp. and would also benefit from volume and price appreciation of its stock. The information provided here within should not be construed as a financial analysis but rather as an advertisement. The author’s views and opinions regarding the companies featured in reports are his own views and are based on information that he has researched independently and has received, which the author assumes to be reliable. Technical Traders Ltd. and the author of this report do not guarantee the accuracy, completeness, or usefulness of any content of this report, nor its fitness for any particular purpose. Lastly, the author does not guarantee that any of the companies mentioned in the reports will perform as expected, and any comparisons made to other companies may not be valid or come into effect.
Chris Vermeulen Archive |
© 2005-2022 http://www.MarketOracle.co.uk - The Market Oracle is a FREE Daily Financial Markets Analysis & Forecasting online publication.