


Small Cap Stocks May Lead A Market Rally
Stock-Markets / Stock Markets 2019 Jun 20, 2019 - 12:08 PM GMTBy: Chris_Vermeulen

 We believe a unique Pennant/Flag formation is setting up in the US stock markets. We believe the Small Cap sector may provide a better technical reference to the price breakout we are expecting in late August or early September than the mid or large-cap sectors. The charts tell a very interesting story when comparing the different sectors to the SPY.
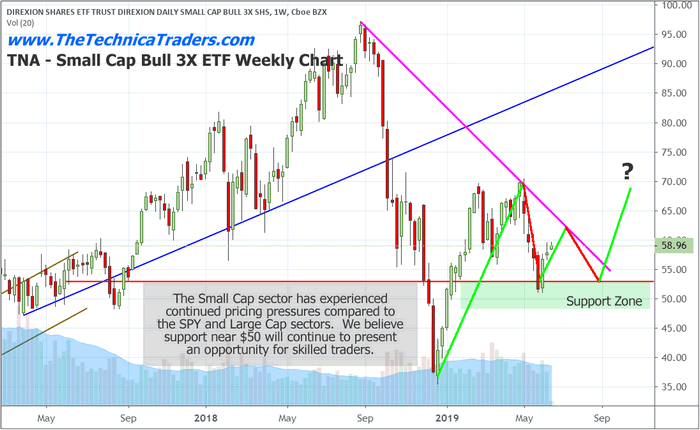
As most of you are well aware, the very deep selloff between October and December 2018 prompted a low price pivot point that most technical analysts are using as a reference to support. What we find interesting is that these Small Caps have really failed to mount any type of price recovery. We believe this is because of the continued capital shift where foreign investors and institutional investors are piling into mid-cap and large-cap equities chasing dividends and safety. The small-cap index chart may provide the best technical reference for the pennant formation and eventual breakout move.
This weekly chart of TNA highlights exactly what we are referencing in comparison to the mid-cap and large-cap charts. Pay very close attention to the support level near $53.50. Also, notice that define panic formation setting up after the December 2018 bottom. We believe the price rotation in the small-cap index is clearer and more identifiable than the rotation in the mid-And large-cap indexes. We also believe the small-cap index will show early warning signs of price weakness or strength after the apex of this move.
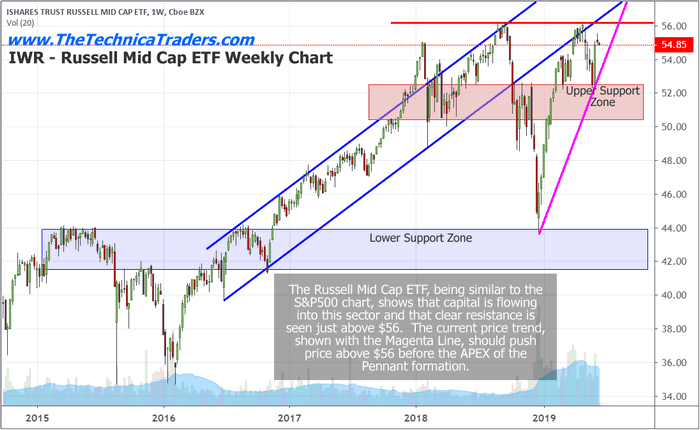
The mid-cap and large-cap weekly charts paint a very different picture than the small-cap chart. We can see the upward price slow after the bottom in December 2018 was much more aggressive. We can also see an upward sloping Pennant formation setting up between the lower, blue, price channel and the magenta upward sloping price channel from the recent lows. Please pay close attention to the upper and lower support zones we drawn on this chart. Any future break down in price will likely find support near the upper support zone and possibly pause near this level before attempting a breakdown further if needed.
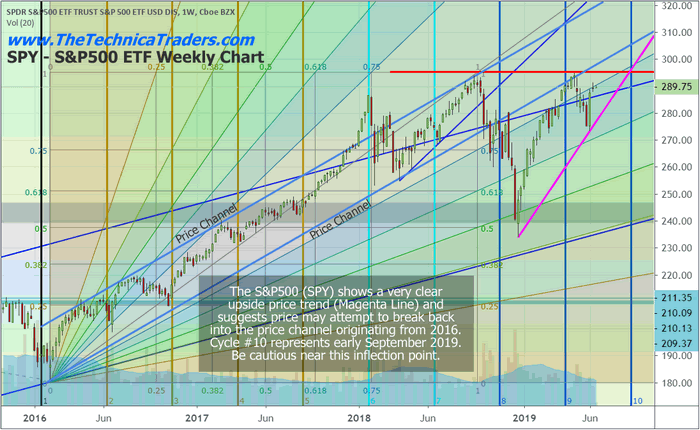
This last SPY weekly chart highlights the similarities between the made In the large-cap indexes. The way price reacts to these channels as well as creates these Pennant formations in unison is rather interesting. Compared to the small chart, the TNA, it is clear that the main and large-cap prices are moving somewhat in tandem.
At this point in the process, we are waiting for wave 3 to end and wave 4 to begin of the pennant formation. As price continues to consolidate within the pennant range, we should take advantage of opportunities that exist within this rotation and prepare for a brief breakout to new all-time highs. After new all-time highs are reached, we believe an immediate downside price rotation will begin sometime in September 2019 and last possibly into October or November 2019 – possibly longer.
Pay attention to vertical line number 10 on this chart. This price cycle reference occurs on September 8, 2019. It also occurs right after the apex of the pennant formation between the red and magenta lines. Our researchers believe a washout high price rotation, targeting new price highs, will be the likely resulting breakout move. After the washout high exhausts, we believe an immediate downside move will likely begin and push prices back below the 282 to 270 level while attempting to find support. Ultimately this downside move may attempt to retest the 240 level or lower. Time will tell.
Our suggestion is to pay attention to the small-cap index in relation to the mid-cap and the large-cap symbols. We believe the small-cap sector will provide greater detail for technical analysts and researchers. Overall, every one of these charts paints a fairly clear picture. We believe our research is accurate and that the market will do exactly as we are suggesting. The only thing that we are unsure of, at this point, is where the new all-time high price level will peak.
Our ADL predictive modeling system is providing some guidance in regards to this peak level. We will continue to provide further guidance and research as these price swings continue. It would be wise to prepare to trade a tightening price channel as this pennant formation continues – then be prepared for some very big price swings in late August and all through September.
We have a good pulse on the major markets and can profit during times when most others can’t which is why you should join my Wealth Trading Newsletter for index, metals, and energy trade alerts.
I can tell you that huge moves are about to start unfolding not only in metals, or stocks but globally and some of these super cycles are going to last years. These super cycles starting to take place will go into 2020 and beyond which we lay out in our new PDF guide: 2020 Cycles – The Greatest Opportunity Of Your Lifetime
I am going to give away and ship out silver rounds to anyone who buys a 1-year, or 2-year subscription to my Wealth Trading Newsletter. You can upgrade to this longer-term subscription or if you are new, join one of these two plans listed below, and you will receive:
1-Year Subscription Gets One 1oz Silver Round FREE (Could be worth hundreds of dollars)
2-Year Subscription Gets TWO 1oz Silver Rounds FREE (Could be worth a lot in the future)
SUBSCRIBE TO MY TRADE ALERTS AND GET YOUR FREE SILVER ROUNDS! Free Shipping!
Chris Vermeulen
www.TheTechnicalTraders.com
Chris Vermeulen has been involved in the markets since 1997 and is the founder of Technical Traders Ltd. He is an internationally recognized technical analyst, trader, and is the author of the book: 7 Steps to Win With Logic
Through years of research, trading and helping individual traders around the world. He learned that many traders have great trading ideas, but they lack one thing, they struggle to execute trades in a systematic way for consistent results. Chris helps educate traders with a three-hour video course that can change your trading results for the better.
His mission is to help his clients boost their trading performance while reducing market exposure and portfolio volatility.
He is a regular speaker on HoweStreet.com, and the FinancialSurvivorNetwork radio shows. Chris was also featured on the cover of AmalgaTrader Magazine, and contributes articles to several leading financial hubs like MarketOracle.co.uk
Disclaimer: Nothing in this report should be construed as a solicitation to buy or sell any securities mentioned. Technical Traders Ltd., its owners and the author of this report are not registered broker-dealers or financial advisors. Before investing in any securities, you should consult with your financial advisor and a registered broker-dealer. Never make an investment based solely on what you read in an online or printed report, including this report, especially if the investment involves a small, thinly-traded company that isn’t well known. Technical Traders Ltd. and the author of this report has been paid by Cardiff Energy Corp. In addition, the author owns shares of Cardiff Energy Corp. and would also benefit from volume and price appreciation of its stock. The information provided here within should not be construed as a financial analysis but rather as an advertisement. The author’s views and opinions regarding the companies featured in reports are his own views and are based on information that he has researched independently and has received, which the author assumes to be reliable. Technical Traders Ltd. and the author of this report do not guarantee the accuracy, completeness, or usefulness of any content of this report, nor its fitness for any particular purpose. Lastly, the author does not guarantee that any of the companies mentioned in the reports will perform as expected, and any comparisons made to other companies may not be valid or come into effect.
Chris Vermeulen Archive |
© 2005-2022 http://www.MarketOracle.co.uk - The Market Oracle is a FREE Daily Financial Markets Analysis & Forecasting online publication.