


How To Time Market Tops and Bottoms
InvestorEducation / Learn to Trade Jun 24, 2019 - 03:17 PM GMTBy: Chris_Vermeulen

 Following the first full weekend of Summer, we thought we would revisit our June 3, 2019 research post regarding a price pattern we love to trade – the Fibonacci Extension Bounce. This pattern sets up fairly often and the key to understanding this pattern and where these trades present real opportunity is in understanding the price dynamics behind these extensions. There are many instances where a Fibonacci price extension level will fail to promote a price bounce or rebound – and the price will just keep trending higher or lower past the extension level.
You can read our original research post here that clearly shows the bottom and our price targets.
Pay very close attention to the price levels and setups of the charts within that June 3, 2019 post. These setups are based on what we term a “100% Fibonacci Extension” from a previous trend reversal (peak or valley). The concept of this trading pattern is that the initial “impulse” price move sets up the first leg of a move. The retracement price move sets up the entry trigger for the second price leg – the next 100% price leg. The bottom, in this case, of the second 100% price leg sets up the “end of the move” and the potential for a price rotation in the opposite direction (likely resulting in a 38% to 61%+ retracement move).
In both instances of our June 3 calls, Crude Oil and the ES followed-through exactly as we predicted.
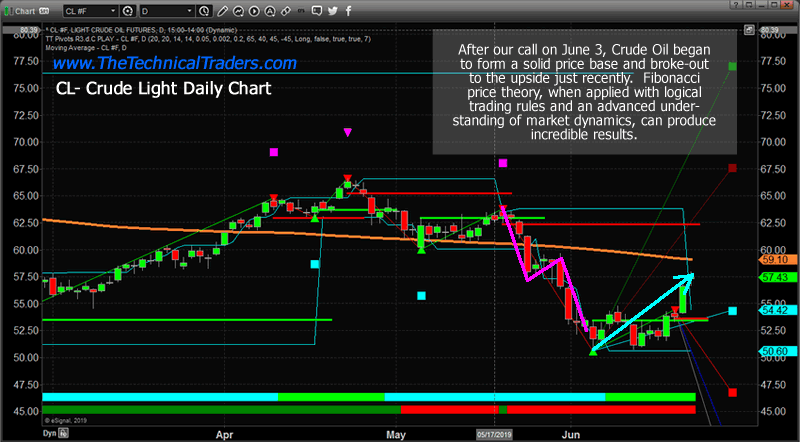
This first chart of Crude Oil shows how price bottomed near $52 and has recently advanced to levels near $58 after reaching the 100% Fibonacci extension levels. As this move higher extends to levels near the ORANGE moving average line on this chart and/or beyond the $58 to $59 target level we originally drew on our June 3rd charts, we would consider the upside price move “completed” based on our expectations. Yes, these types of trend could extend even further beyond our expectations. But our objective, as skilled traders, is to target and profit from the highest probability objectives – which was the move from $52 to near current price levels.
Follow the MAGENTA lines on these charts to see the Fibonacci Extension Pattern Setup. They are not hard to see on the charts when your eyes are trained to identify them.
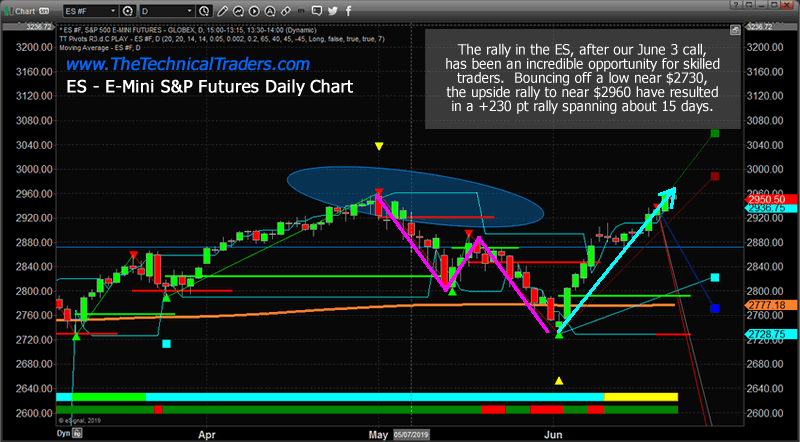
This ES Daily chart shows the incredible +230 point rally that took place after our June 3 research post and after the Fibonacci extension pattern completed. It is really hard to miss the opportunity with a move like this. Again, follow the MAGENTA lines on this chart to see the Fibonacci Extension pattern setup.
At this point on the ES chart, the upside price rally has resulted in a 161% (roughly) upside price advance of the previous Fibonacci Extension pattern (last leg). This upside price leg range, 161%, suggests the upside price move should be close to ending soon. There is a possibility that price could advance to levels near 200% of the previous price leg range, but traders would be chasing a 25% further upside advance that may only be a low probability outcome.
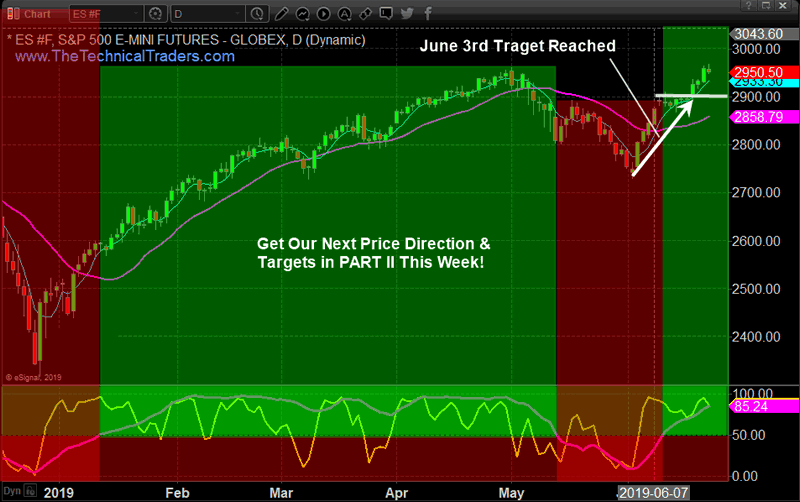
Our advice for skilled traders is to pare back existing open long trade positions near these new all-time highs. The price advance appears to have reached levels that suggest the upside advance may be nearing an end point for the US stock markets. After such a big upside price leg, we have to be cautious near these new all-time highs that further price rotation may become a concern.
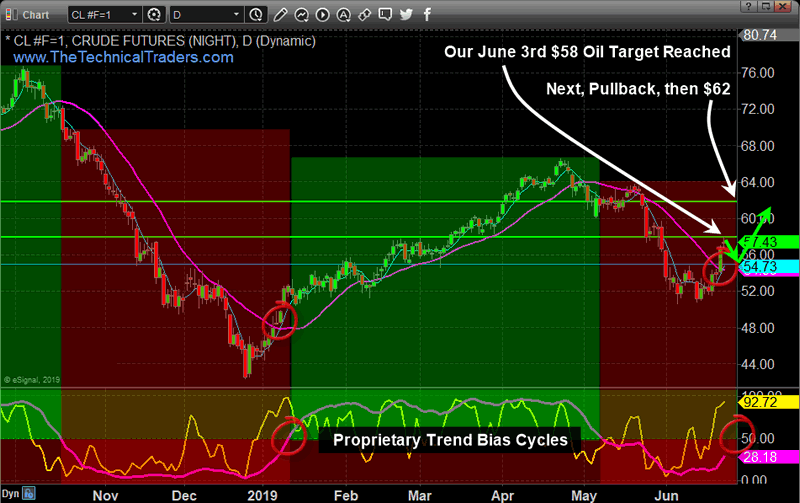
Oil, on the other hand, could continue to rally because it has only advanced 61% of the last Fibonacci 100% price leg. The global concerns regarding Iran and the US, as well as global economic concerns, could push Oil back up to the $60 to $62 level before reaching a peak.
Over the past 21+ months, we’ve highlighted some of the best tools and techniques we use to find great trading signals. This one technique, the Fibonacci 100% Price Expansion Leg, is just one of the tools we use to find trades and targets for our trade alerts for members.
The more one understands how price works and how the markets operate as a Symphony of price actions, one can find opportunities for great trades almost all the time. Skill and experience make the difference when deciding when to trade and what to trade and that’s what we provide.
More eye opening charts on currencies and gold here
We’ve now shown you two different price setups using Fibonacci price theory and the only thing we have to do is wait for a technical price confirmation before finding our entry trade. We’ll see how this plays out over the next few days and weeks. Remember, we are not proposing these as “major price bottoms”. They are “upside pullback trades” (bounces) at this point. A bullish price pullback in a downtrend.
BECOME A TECHNICAL TRADER TODAY AND
TRADE WHAT MATTERS – PRICE ACTION!
CLICK HERE
SUBSCRIBE TO MY TRADE ALERTS AND GET YOUR FREE SILVER ROUNDS! Free Shipping!
Chris Vermeulen
www.TheTechnicalTraders.com
Chris Vermeulen has been involved in the markets since 1997 and is the founder of Technical Traders Ltd. He is an internationally recognized technical analyst, trader, and is the author of the book: 7 Steps to Win With Logic
Through years of research, trading and helping individual traders around the world. He learned that many traders have great trading ideas, but they lack one thing, they struggle to execute trades in a systematic way for consistent results. Chris helps educate traders with a three-hour video course that can change your trading results for the better.
His mission is to help his clients boost their trading performance while reducing market exposure and portfolio volatility.
He is a regular speaker on HoweStreet.com, and the FinancialSurvivorNetwork radio shows. Chris was also featured on the cover of AmalgaTrader Magazine, and contributes articles to several leading financial hubs like MarketOracle.co.uk
Disclaimer: Nothing in this report should be construed as a solicitation to buy or sell any securities mentioned. Technical Traders Ltd., its owners and the author of this report are not registered broker-dealers or financial advisors. Before investing in any securities, you should consult with your financial advisor and a registered broker-dealer. Never make an investment based solely on what you read in an online or printed report, including this report, especially if the investment involves a small, thinly-traded company that isn’t well known. Technical Traders Ltd. and the author of this report has been paid by Cardiff Energy Corp. In addition, the author owns shares of Cardiff Energy Corp. and would also benefit from volume and price appreciation of its stock. The information provided here within should not be construed as a financial analysis but rather as an advertisement. The author’s views and opinions regarding the companies featured in reports are his own views and are based on information that he has researched independently and has received, which the author assumes to be reliable. Technical Traders Ltd. and the author of this report do not guarantee the accuracy, completeness, or usefulness of any content of this report, nor its fitness for any particular purpose. Lastly, the author does not guarantee that any of the companies mentioned in the reports will perform as expected, and any comparisons made to other companies may not be valid or come into effect.
Chris Vermeulen Archive |
© 2005-2022 http://www.MarketOracle.co.uk - The Market Oracle is a FREE Daily Financial Markets Analysis & Forecasting online publication.