


Sahm Unemployment Index and Gold
Commodities / Gold & Silver 2019 Jul 20, 2019 - 12:40 PM GMTBy: Arkadiusz_Sieron

 What is the difference between a recession and a depression? When your neighbor loses their job, it’s a recession. When you lose your job, that’s a depression! Not funny? Do not worry, we won’t make more jokes. Instead, we’ll analyze a new, but very important and powerful recessionary indicator. We invite you to read our today’s article, which discusses the Sahm Unemployment Index, and find out what does it say about the US economy and the gold market.
What is the difference between a recession and a depression? When your neighbor loses their job, it’s a recession. When you lose your job, that’s a depression!
But let’s put the dry economic and not funny jokes aside. How to spot recession, without asking your neighbors about their situation at work? As we wrote in the March 2019 edition of the Market Overview, the two most reliable recessionary indicators are the yield curve and the unemployment rate (eventually, you may have to talk with your neighbors after all!). However, these are also not perfect. Many economists claim that the yield curve has lost some of its predictive power to the quantitative easing. Meanwhile, it’s not easy to determine the trough in the unemployment rate in real time. How do we know whether the increase in the unemployment rate is the start of a new recessionary trend or just a temporary jump?
Well, economists to the rescue! Claudia Sahm, an economist at the Fed, has developed a new method for predicting economic downturns. In her chapter within the book Recession Ready: Fiscal Policies to Stabilize the American Economy, she develops an indicator based on the unemployment rate, but better. Sahm argues that economy is headed for recession, when the three-month average unemployment rate is at least 50 basis points above its minimum from the previous twelve months.
Why the three-month average is used? It smooths out some of the monthly random variation in the rate and avoids false positives. And why do we use moving average minimum? In contrast to a fixed unemployment rate threshold, this type of trigger takes into account structural changes over time in the natural rate of unemployment. Moreover, rapid increases are informative regardless of the level of the unemployment rate. Let’s take a look!
Chart 1: Sahm’s Index (the difference between the three-month average of unemployment rate and the minimum from the previous twelve months) from January 1970 to May 2019.
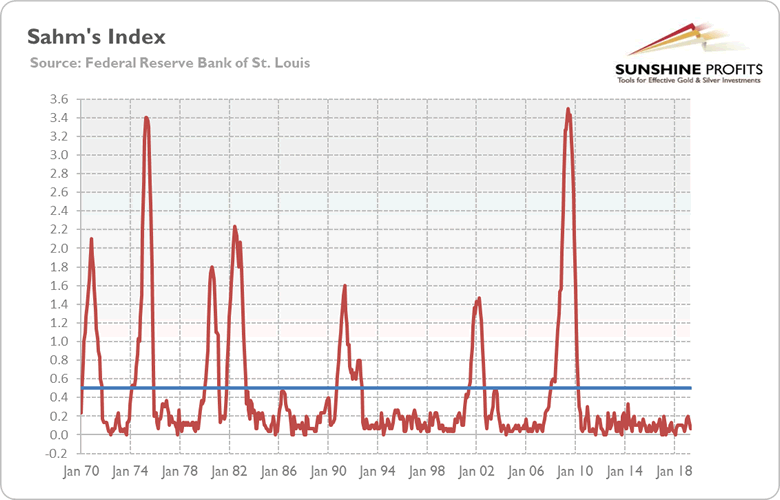
Wow, as the chart above shows, the mentioned index has correctly called every US recession since 1970. For instance, the indicator sent an alarm signal in January 2008, warning of the unfolding Great Recession.
What is more, the new indicator detected few, if any, false positives. It touched, but did not cross, 0.5 percentage point shortly in 1986 and 2003. It makes the Sahm’s index really reliable.
However, the indicator is not perfect. Its Achilles heel is timeliness. For example, it flashed red in September 1990, two months after the official beginning of the recession. Similarly, the index rang a bell in July 2001, three months after the Nasdaq peaked and the dot-com bubble started bursting. It’s a significant limitation – after all, anticipating recession is far more useful for investors than acknowledging that we are just experiencing one. For comparison, the yield curve’s inversion signals a recession about four to six quarters before the recession starts.
But do not count this indicator out! After all, knowing that we are in a recession is also valuable. Remember that the NBER determine the official date ex post, several months after the start of the recession. And although the Sahm’s index flashed red in January 2008, one month after the official start of recession, it signaled danger several months before the bankruptcy of the Lehman Brothers, when the worst started.
OK, so what is the index saying to us now? It tells us not to worry. The three-month average unemployment rate is just 0.1 percentage point above its minimum of the past twelve months. It implies that we are not in recession. And it suggests that the downturn might not be as imminent as widely believed. Based on the indicator, the chances of a recession occurring in the next twelve months is about 20-33 percent. After all, the Sahm’s indicator stays at a very low level, and it is not rising toward the recessionary threshold.
That’s is bad news for gold. The yellow metal perform best when the economy is steeped in a crisis. We are still not there, my bullish friends. However, remember that bullion tends to appreciate not only during recessions. Just look at the chart below: the 2000s bull market in gold coincided with Sahm’s index well below the trigger level!
Chart 2: Sahm’s Index (red line, left axis, the difference between the three-month average of unemployment rate and the minimum from the previous twelve months, in %) and the price of gold (yellow line, right axis, in $, London P.M. Fix) from January 1970 to May 2019.
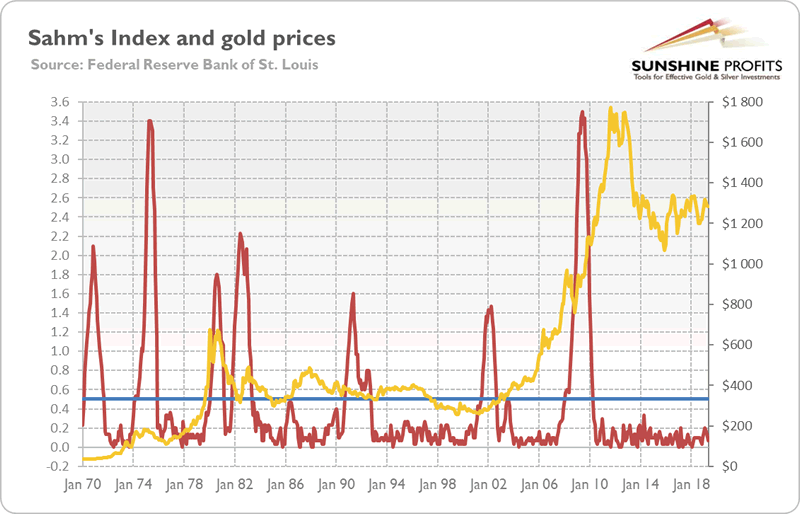
And the Sahm’s index has limited ability to spot the recession in advance. The yield curve has already inverted, so we cannot exclude that the new indicator will also flash red, but only later.
If you enjoyed the above analysis, we invite you to check out our other services. We provide detailed fundamental analyses of the gold market in our monthly Gold Market Overview reports and we provide daily Gold & Silver Trading Alerts with clear buy and sell signals. If you’re not ready to subscribe yet and are not on our gold mailing list yet, we urge you to sign up. It’s free and if you don’t like it, you can easily unsubscribe. Sign up today!
Arkadiusz Sieron
Sunshine Profits‘ Market Overview Editor
Disclaimer
All essays, research and information found above represent analyses and opinions of Przemyslaw Radomski, CFA and Sunshine Profits' associates only. As such, it may prove wrong and be a subject to change without notice. Opinions and analyses were based on data available to authors of respective essays at the time of writing. Although the information provided above is based on careful research and sources that are believed to be accurate, Przemyslaw Radomski, CFA and his associates do not guarantee the accuracy or thoroughness of the data or information reported. The opinions published above are neither an offer nor a recommendation to purchase or sell any securities. Mr. Radomski is not a Registered Securities Advisor. By reading Przemyslaw Radomski's, CFA reports you fully agree that he will not be held responsible or liable for any decisions you make regarding any information provided in these reports. Investing, trading and speculation in any financial markets may involve high risk of loss. Przemyslaw Radomski, CFA, Sunshine Profits' employees and affiliates as well as members of their families may have a short or long position in any securities, including those mentioned in any of the reports or essays, and may make additional purchases and/or sales of those securities without notice.
Arkadiusz Sieron Archive |
© 2005-2022 http://www.MarketOracle.co.uk - The Market Oracle is a FREE Daily Financial Markets Analysis & Forecasting online publication.