


What you Really need to Know about the Stock Market
Stock-Markets / Stock Markets 2019 Jul 22, 2019 - 10:43 AM GMTBy: Troy_Bombardia

 If you read financial news & market analysis from pundits every day, it’s easy to be overwhelmed by countless charts, data, indicators, opinions, etc. In this post, I’m going to focus on what I think really matters for the stock market right now. A quick recap:
- Long term risk:reward does not favor bulls
- Fundamentals (next 6-9 months): favors bulls
- Technicals (next 6-9 months): favors bulls (i.e. late cycle rally)
- Short term: mixed/bearish
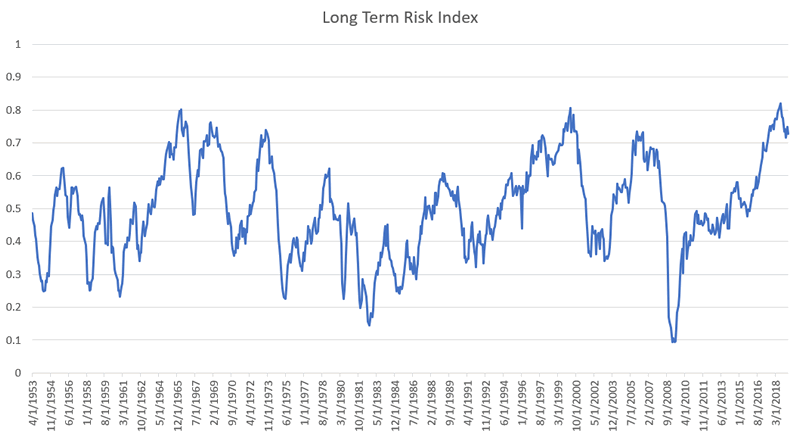
Long term risk:reward
It is extremely hard to predict the exact top of each bull market or exact bottom of each bear market. Sure, some people get lucky once or twice. But no one can consistently and accurately predict each exact top.
That’s why it’s better to think about the long term from a risk:reward perspective. Risk:reward will not tell you if the top is today, this week, or this month. But it will give you an estimate of where we are in the bull market and economic expansion.
Valuations
Valuations are high. Various indicators such as Tobin’s Q and the Shiller P/E have been stretched for years. Here’s the Shiller P/E ratio:
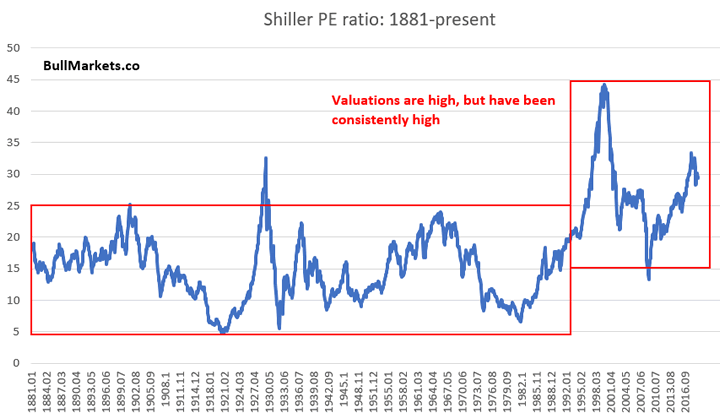
However, valuations have been consistently high for the past 20+ years. A key problem with popular valuation metrics is that they do not take into consideration interest rates, which are extremely low right now.

Various assets compete with eachother for investors’ dollars. When rates are low, more and more investors are pushed into equities in a reach for yield. As a result, equity valuations are consistently higher than in the past.
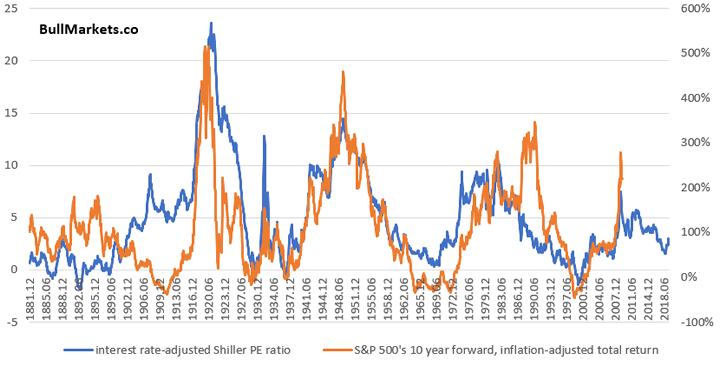
Hence, it’s better to adjust valuations with interest rates (this is what Warren Buffett suggests). The following chart illustrates the interest-rate adjusted Shiller earnings/price ratio (inverse of the P/E ratio). Major tops often coincide with earnings ratios of 0%.
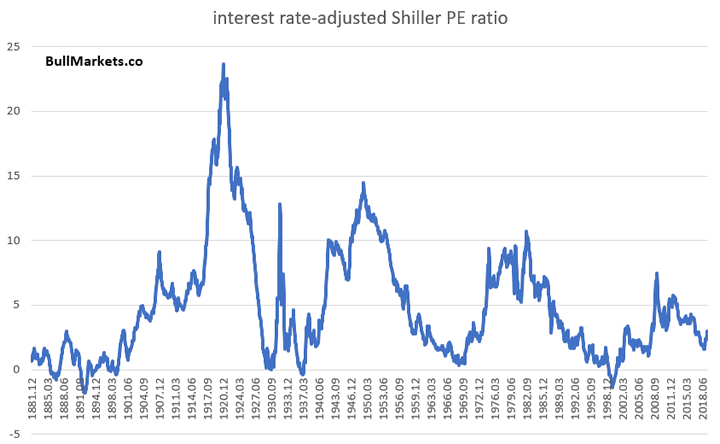
Next, we can plot this valuation indicator against the S&P 500’s 10 year forward, inflation-adjusted total return.
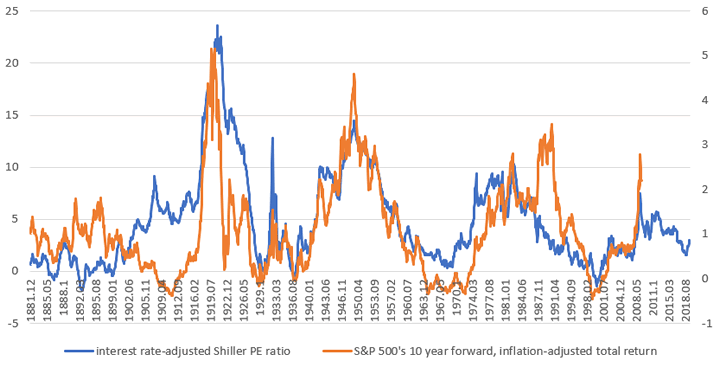
While we do not know when the bull market will end, we do know that:
- We are in the late stages of this bull market. December 2018 probably was not a long term cyclical bottom (contrary to what some bulls believe).
- The next 10 years will be worse for stocks than the previous 10 years.
High valuations create the preconditions for a bear market – necessary but not sufficient.
So what causes a bear market?
Fundamentals.
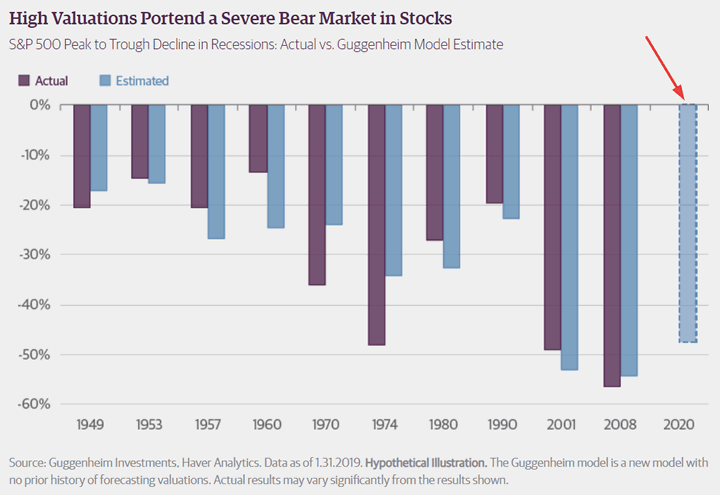
- Low valuations + recession = big correction (e.g. 20-30%)
- High valuations + recession = bear market (e.g. 40-50%)
Valuations are high right now, which suggests that the next recession will probably coincide with a big bear market. This is what Guggenheim has noted as well. The size of a bear market isn’t really related to the intensity of the recession, as it is related to valuations during the previous bull market’s top.
With that being said, fundamentals suggest that a recession is not imminent. There are pockets of weakness (housing, manufacturing, etc), but overall the economy is still growing. This is supportive of the bull market in stocks, even though this is late-stage.
Fundamentals
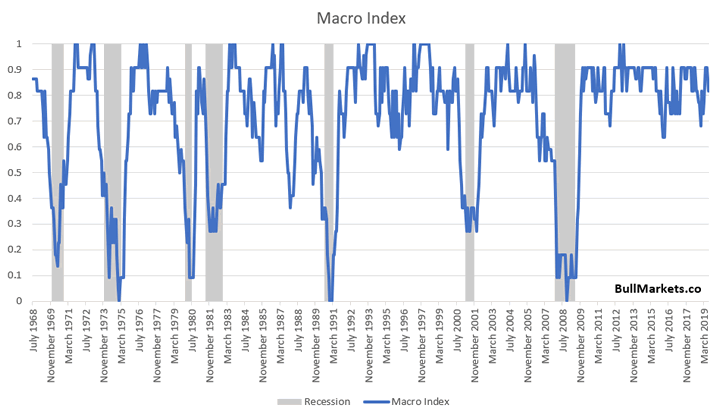
Making macro-predictions is hard. Most predictions are no better than a 50/50 coin toss. That’s why instead of predicting the future, we look at leading economic indicators that tend to deteriorate before recessions begin. There are many leading indicators, some of which we use in our Macro Index. The Macro Index looks for significant deterioration in the U.S. economy.
Macro Index
While the Macro Index has deteriorated due to weakness in some sectors such as housing, overall it remains fine. There is no significant deterioration.
Now let’s take a look at some leading sectors.
Housing is a slight negative factor
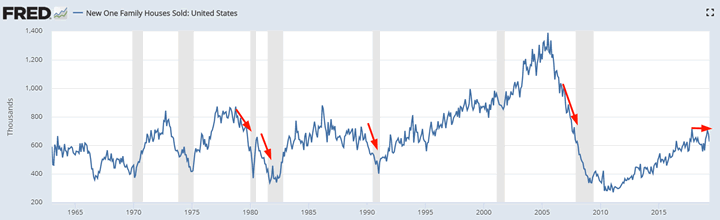
Housing – a key leading sector for the economy – remains weak. Housing Starts and Building Permits are trending downwards while New Home Sales is trending sideways. In the past, these 3 indicators trended downwards before recessions and bear markets began.
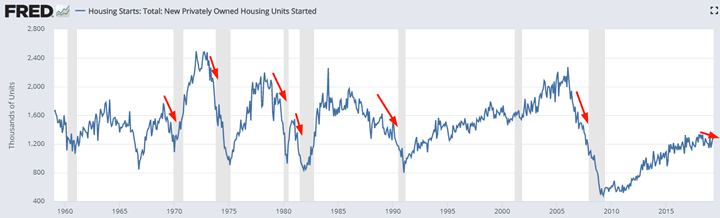
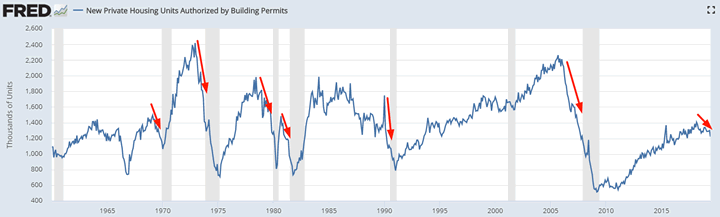
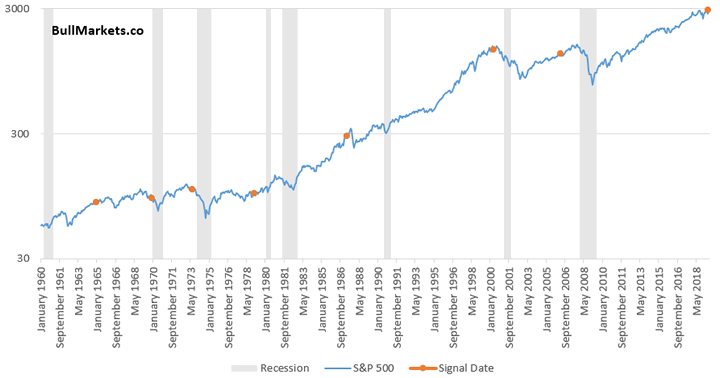
As I illustrated on Wednesday, Building Permits falling to a 2 year low (i.e. right now) is not good for the stock market.
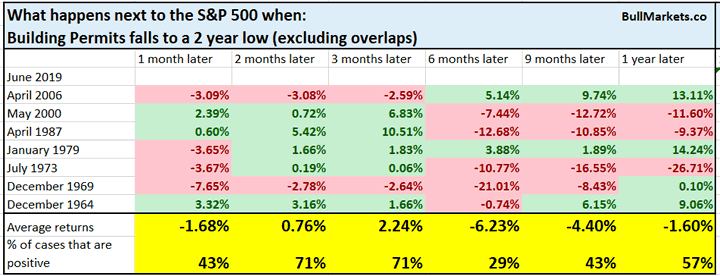
However, an indicator should never be taken in isolation because at any given point in time, you can always find an indicator that fits your pre-determined bias.
Yield Curve
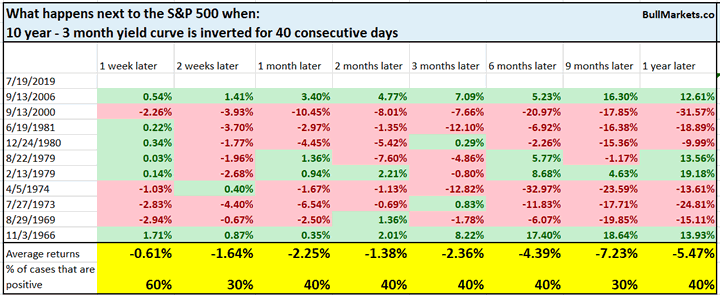
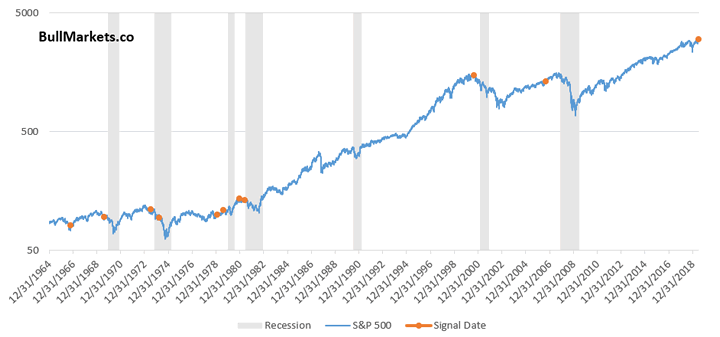
The inverted yield curve also suggests that the bull market’s top is not years away. The 10 year – 3 month yield curve has been inverted for 40 consecutive days.
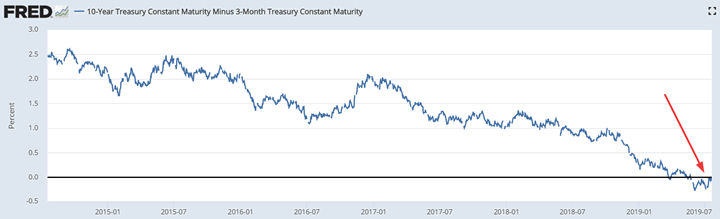
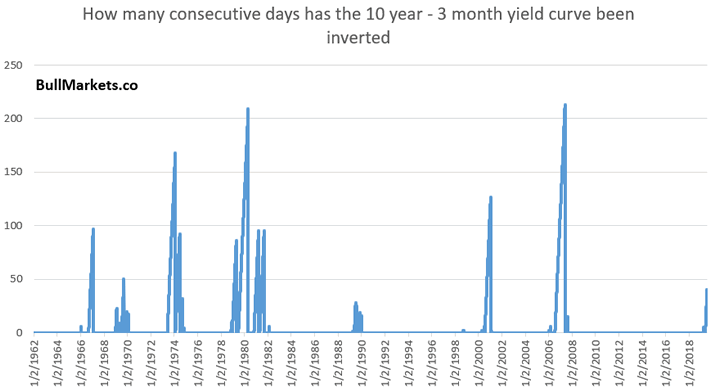
Historically, this was not a good long term sign for stocks.
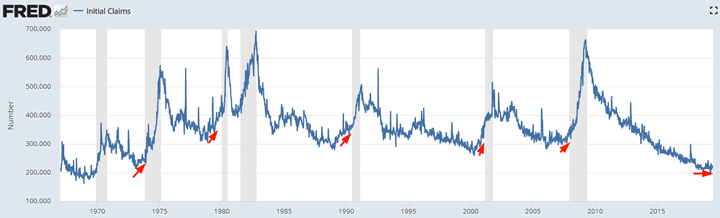
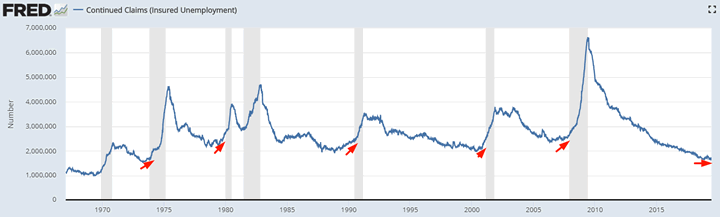
Labor market is still a positive factor
The labor market is still a positive factor for macro. Initial Claims and Continued Claims are trending sideways. In the past, these 2 leading indicators trended higher before bear markets and recessions began.
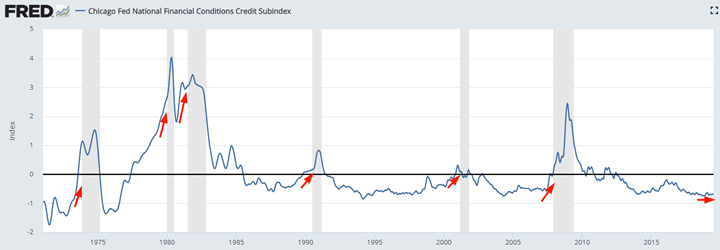
Financial conditions
Financial conditions remain very loose. In the past, financial conditions tightened before recessions and bear markets began.
Here’s the Chicago Fed’s Financial Conditions Credit Subindex
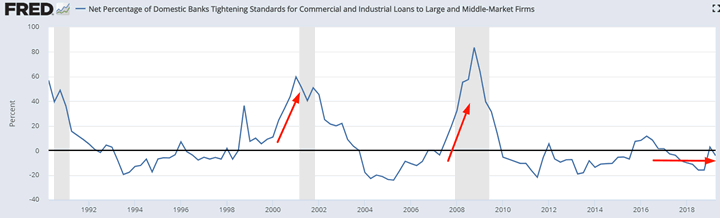
Here’s banks’ lending standards. Whereas lending standards remain loose today, they tightened significantly before the previous 2 bear markets and recessions.
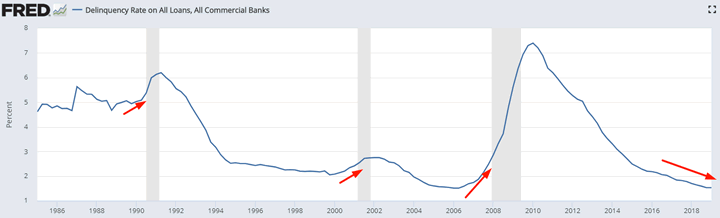
Delinquency Rates
Delinquency rates continue to trend downwards. In the past, this indicator trended upwards before recessions and bear markets began.
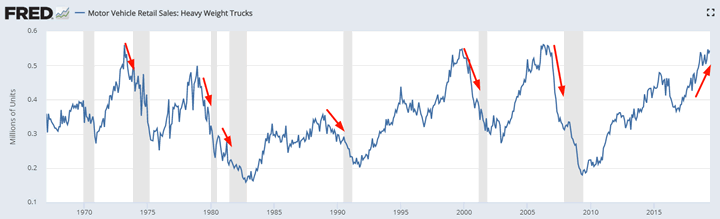
Heavy Truck Sales
Heavy Truck Sales is still trending upwards. In the past, Heavy Truck Sales trended downwards before recessions and bear markets began.
Technicals: Medium Term
*For reference, here’s the random probability of the U.S. stock market going up on any given day, week, or month.

Various technical indicators suggest more gains for the stock market over the next 6-9 months. However, the rally will probably be much choppier and weaker than the past 7 months. There will be pullbacks and corrections.
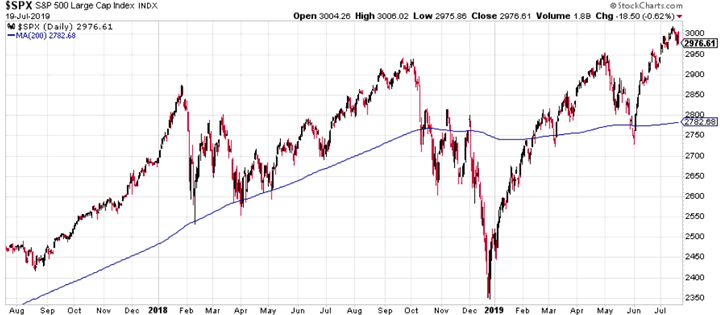
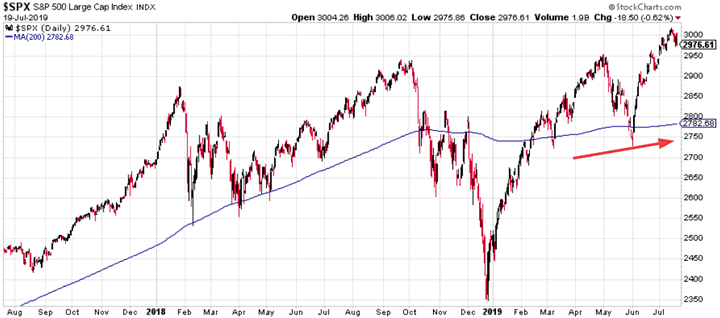
Trend
From a trend following perspective, the S&P is above its 200 day moving average.
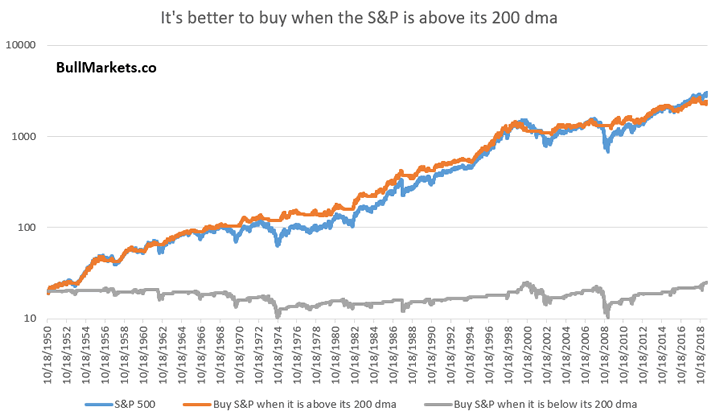
As we know, it’s better to buy the S&P when it is above its 200 dma, than to buy the S&P when it is below its 200 dma.
However, not all indices are trending upwards. Small caps continue to perform poorly, with the Russell’s 200 day moving average going downwards.
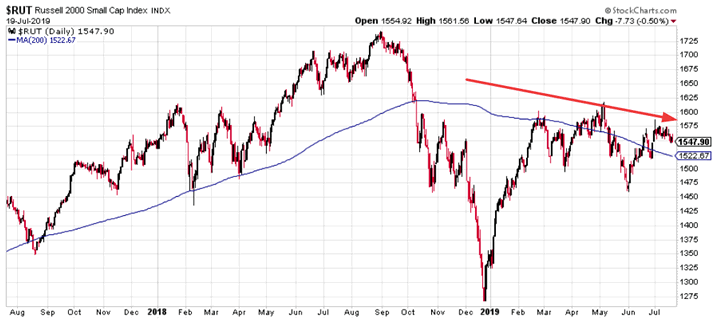
How do we square the difference between large caps and small caps? I.e. when large caps are trending up (S&P’s 200 dma is going up) and small caps are trending down (Russell’s 200 dma is going down), who should we listen to?
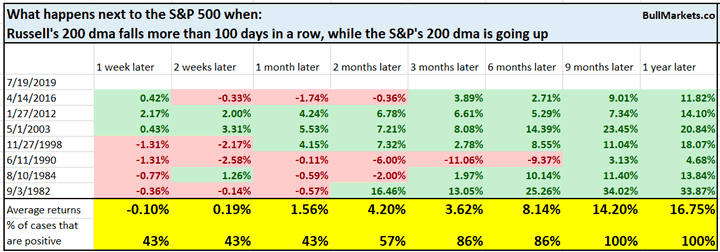
Here’s what happened next to the S&P when the Russell’s 200 dma fell more than 100 days in a row, while the S&P’s 200 dma was going up.
Here’s what happened next to the Russell.
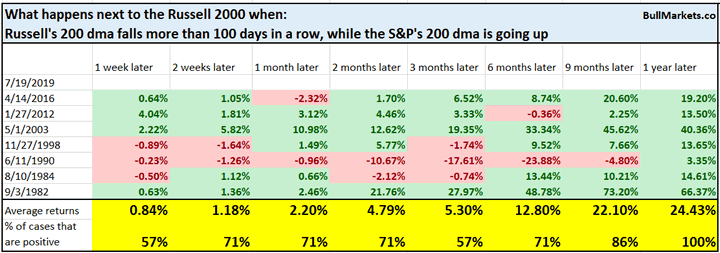
Both the S&P and the Russell tend to go up 6-12 months later. Moreover, the Russell tends to outperform eventually because it has lagged for so long.
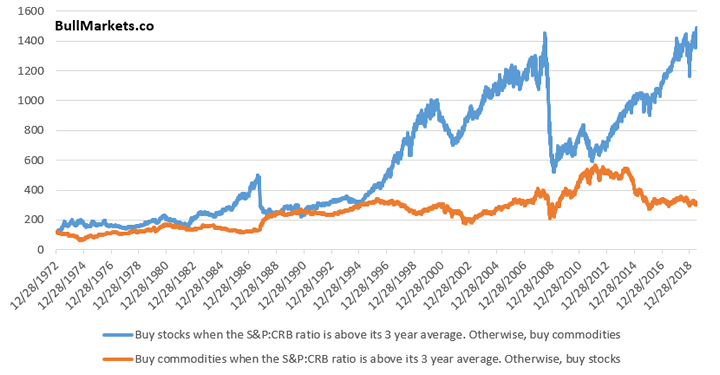
Stocks vs. Commodities
I saw a bunch of charts this week that compared stocks vs. commodities, thereby demonstrating that “stocks are extremely expensive compared to commodities. Sell stocks, buy commodities like gold!” For example, here’s the S&P vs. CRB ratio
*CRB tracks a basket of commodities.
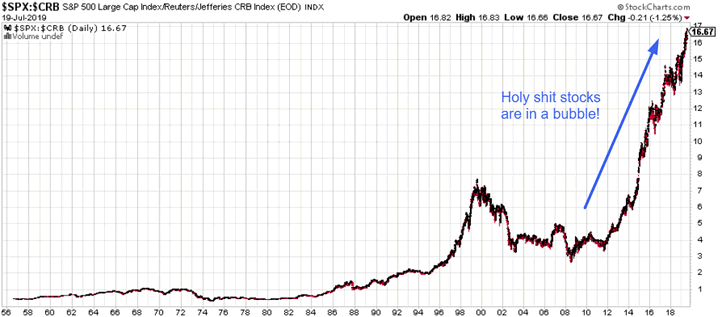
These charts are problematic:
- Stocks almost always outperforms commodities in the long run, because Corporate America grows its earnings throughout the decades. Commodities don’t grow. 1 ounce of gold will always be 1 bounce of gold. Comparing a growing asset with an asset that doesn’t grow is comparing apples to oranges.
- Hence this indicator is not range-bound. “Eventually” it will fall and commodities will outperform stocks. But no one knows when. (How many people have said “sell stocks, buy commodities” over the past 6 years?)
It’s better to:
- Buy stocks when stocks are outperforming, and buy commodities when commodities are outperforming than to….
- Buy stocks when stocks are underperforming and sell commodities when commodities are outperforming.
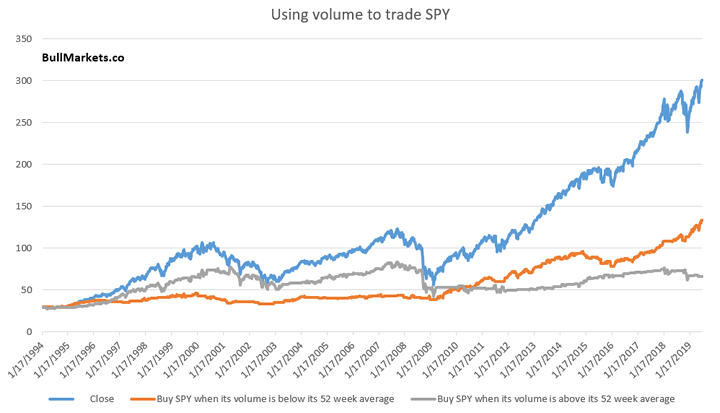
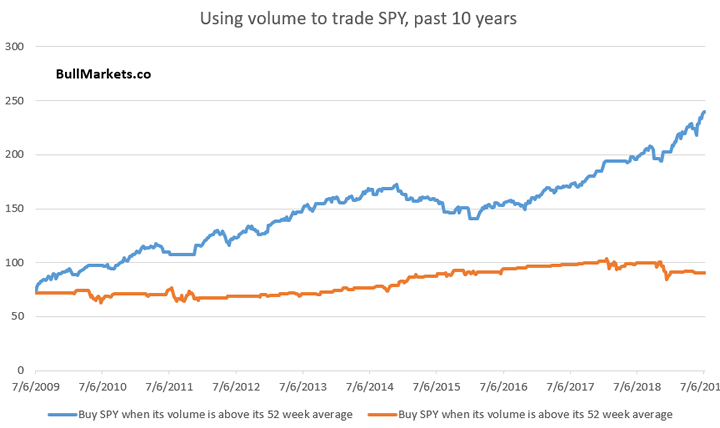
Volume
Many market watchers have talked about the stock market’s relatively low volume over the past few months, which they believe to be a bearish sign for stocks.
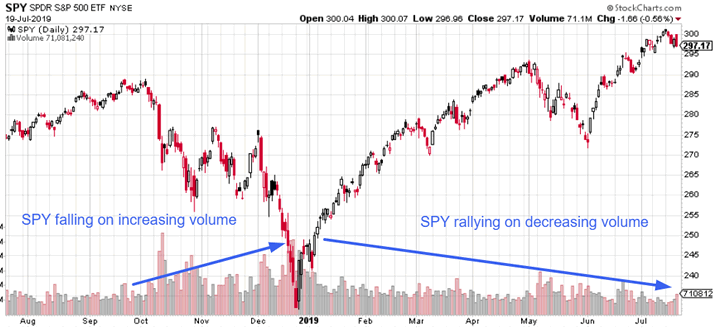
On Monday I demonstrated that it’s better to buy SPY (S&P 500 etf) when volume is below average than when it is above average. This has been particularly true over the past 10 years.
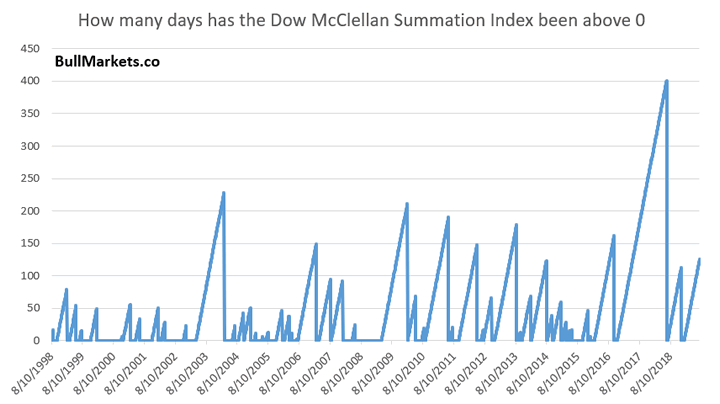
Breadth

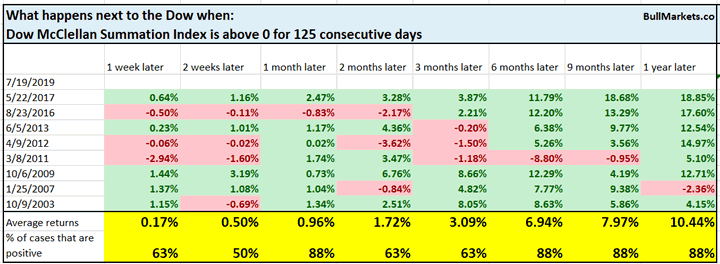
The Dow McClellan Summation Index is a long term breadth indicator. Breadth has been positive (above zero) for 125 consecutive days, which is a long time.
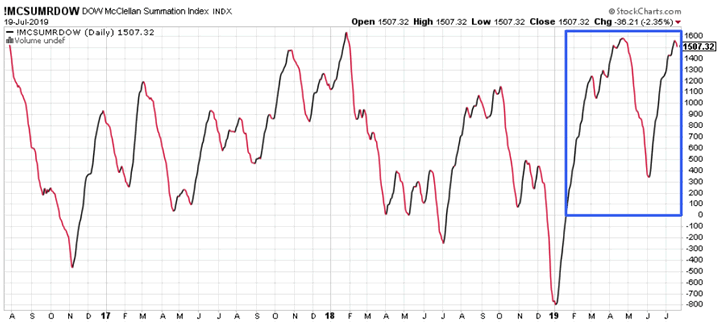
At this point, we can pretty much expect breadth to start rolling over. While this may lead to a short term pullback, it is mostly positive for stocks 6-12 months later.
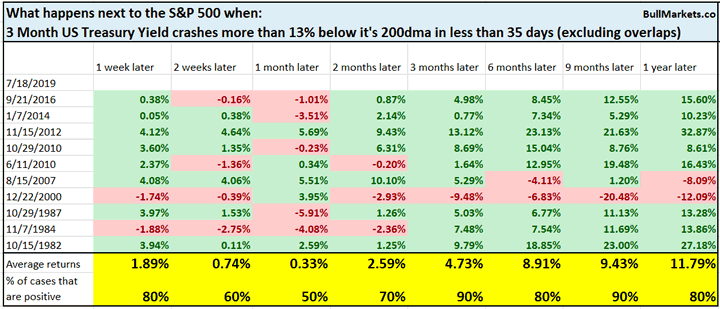
Treasury yields
As the market prepares for rate cuts, the 3 month Treasury yield has tanked recently.
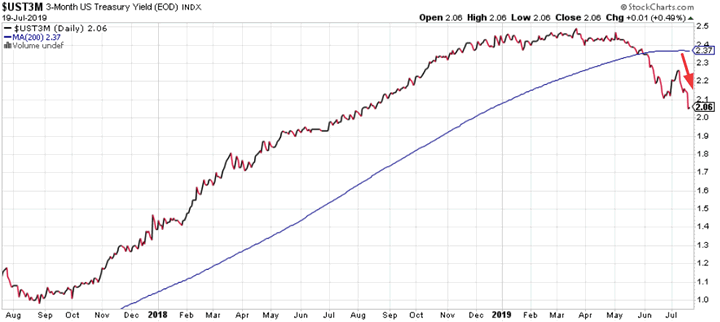
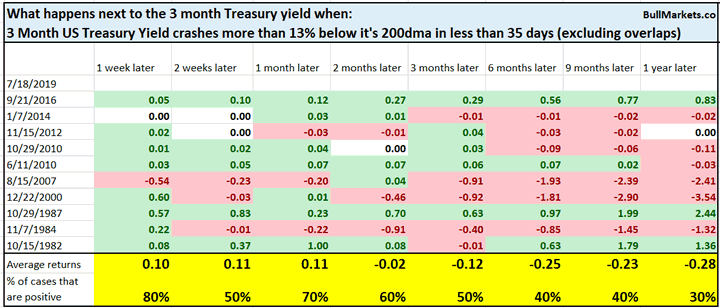
Similar collapses in the 3 month Treasury yield were mostly bullish for stocks 3 months and 9 months later…
… and short term bullish for the 3 month Treasury yield.
Short Term (next 1-3 months)
The next 1-3 months will probably be choppy for the stock market.
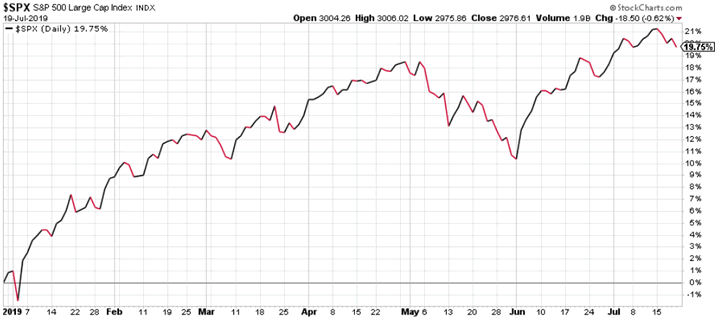
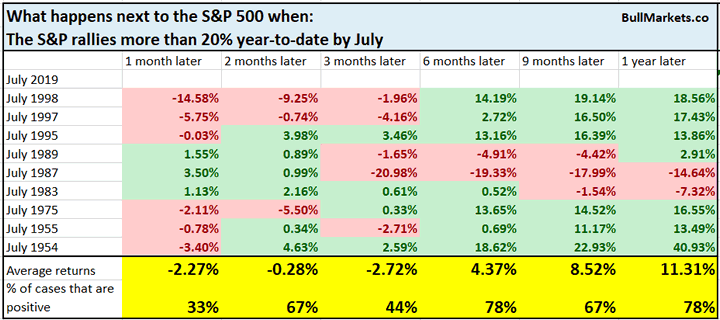
20% year-to-date
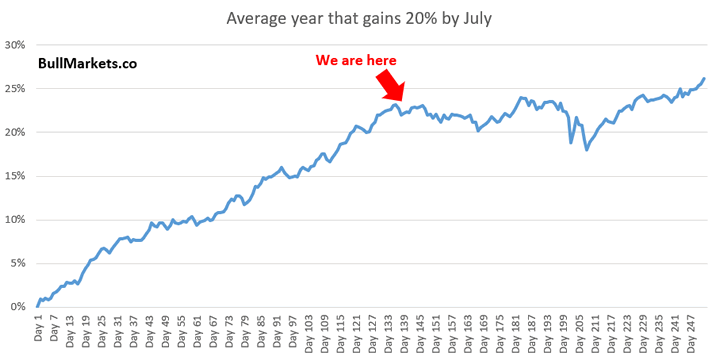
By the start of this month, the S&P had already gained 20% year-to-date.
When the S&P gains 20% by July, the next 3 months (August – October) tend to be choppy.
Put/Call
The Put/Call ratio rose this Friday, after being subdued for more than a month.
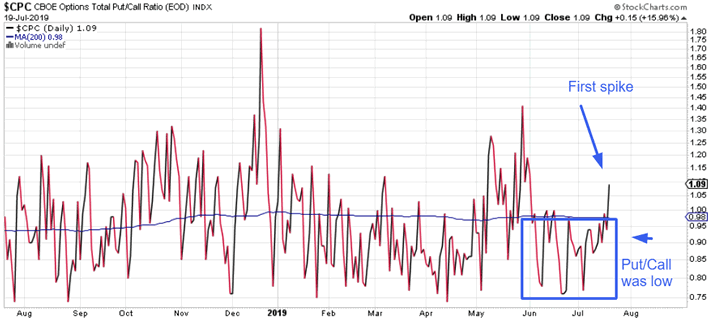
The first spike in Put/Call usually isn’t the end of short term selling in the stock market. Here’s what happened next to the S&P when the Put/Call ratio was more than 5% above its 200 dma, for the first time in more than 30 days.
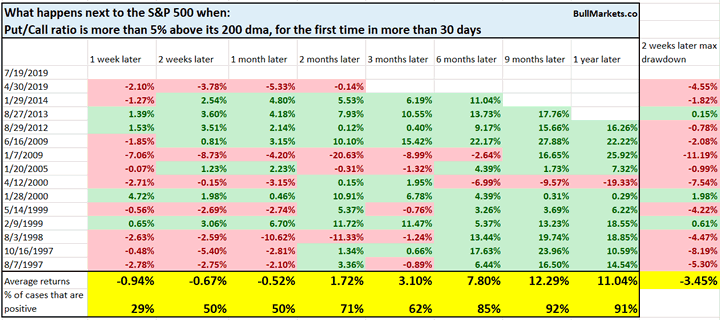
Historically, short term bearish 1 week later.
We don’t use our discretionary outlook for trading. We use our quantitative trading models because they are end-to-end systems that tell you how to trade ALL THE TIME, even when our discretionary outlook is mixed. Members can see our model’s latest trades here updated in real-time.
Conclusion
Here is our discretionary market outlook:
- Long term: risk:reward is not bullish. In a most optimistic scenario, the bull market probably has 1 year left.
- Medium term (next 6-9 months): most market studies are bullish.
- Short term (next 1-3 months) market studies are neutral/bearish.
- We focus on the medium-long term.
Goldman Sachs’ Bull/Bear Indicator demonstrates that risk:reward does favor long term bears.
Click here for more market analysis
Here’s what happens next to the S&P when lumber rallies above its 50 week moving
By Troy Bombardia
I’m Troy Bombardia, the author behind BullMarkets.co. I used to run a hedge fund, but closed it due to a major health scare. I am now enjoying life and simply investing/trading my own account. I focus on long term performance and ignore short term performance.
Copyright 2019 © Troy Bombardia - All Rights Reserved
Disclaimer: The above is a matter of opinion provided for general information purposes only and is not intended as investment advice. Information and analysis above are derived from sources and utilising methods believed to be reliable, but we cannot accept responsibility for any losses you may incur as a result of this analysis. Individuals should consult with their personal financial advisors.
Troy Bombardia Archive |
© 2005-2022 http://www.MarketOracle.co.uk - The Market Oracle is a FREE Daily Financial Markets Analysis & Forecasting online publication.