


All Eyes On Copper
Commodities / Copper Aug 12, 2019 - 01:32 PM GMTBy: Chris_Vermeulen

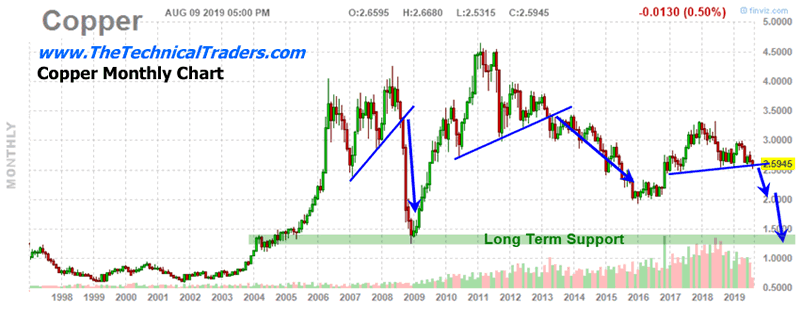
 Copper is a fairly strong measure of the strength and capacity of the global economy and global manufacturing. Right now, Copper has been under quite a bit of pricing pressure and has fallen from levels above $4.50 (near 2011) to levels near $2.55. Most recently, Copper has rotated higher to levels near $3.25 after President Trump was elected on November 2016, yet has recently fallen as trade and global economic concerns become more intense.
This should be viewed as a strong warning sign that institutional traders and investors are very concerned that the future economic and manufacturing activities throughout the world are continuing to contract. Copper is used in various forms throughout all types of manufacturing and consumer products, such as computers, building & infrastructure, electronics, chemical & medical use as well as automobile and aircraft manufacturing. It makes sense that copper prices would be a leading indicator for much of the global economy and relate to economic output and capacity.
Copper Monthly Long Term Chart
As the US/China trade war continues and we enter the final stretch of the US Presidential election cycle, we believe that copper will breakdown below the $2.50 level and attempt to identify past support levels below slightly $1.50 over the next 6 to 12+ months. We believe the next big move in commodities will be a contraction move where certain commodities (mostly manufacturing & industrial related) will collapse as the world focuses on two of the most important events that are about to conclude in 16+ months: the US Presidential elections and the Global Trade/Economic issues.
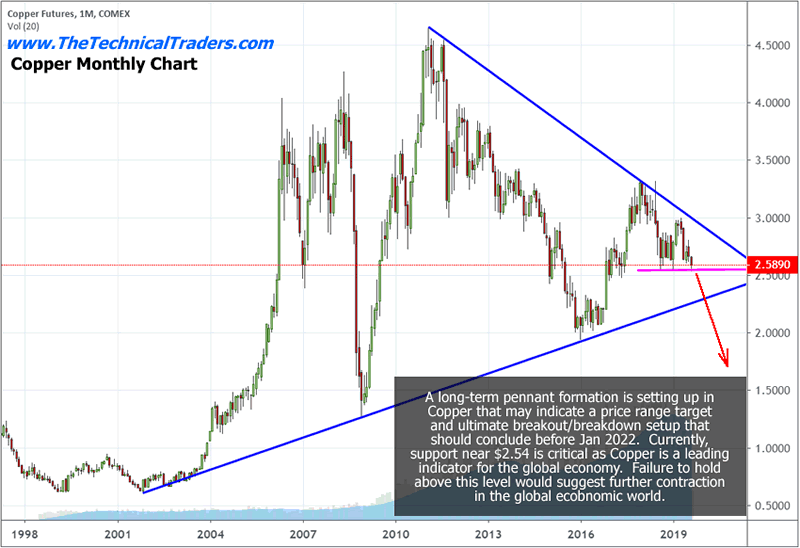
Copper Monthly Pennant Pattern
The breakdown in commodity prices as related to slower expectations and global economic demand may see a dramatic downside move or may see a more measured “slide” towards the $1.45 level (much like what we saw happen between 2013 and 2016). Overall, though, we believe the downside price move outweighs the upside at this time – unless some type of dramatic resolution to the US/China trade issues and global economic slowdown are ended.
We’ve also highlighted an extended long-term Pennant/Flag formation in Copper that should provide further insight as to the range of price rotation before the bigger breakdown in price occurs. This pennant formation will likely contain the immediate price range/rotation over the next few months to between $2.30 to $3.00. Should price break below the $2.25 level within the next 2~6+ months, then we would expect an immediate downside move towards the $1.50 level.
CONCLUDING THOUGHTS:
Following the core commodities as related to global economic and manufacturing demand and capacity are key elements to understanding how traders and investors are viewing the future expectations for the global markets. Commodities like Copper, Gold, Silver, Oil, Natural Gas and others can often be leading indicators related to global economic output and expectations. We urge all traders to prepare for a broader market contraction event over the next 6 to 12+ months based on our research that suggests Copper is setting up for a breakdown move.
These global market price swings in 2019 and 2020 are going to be huge events that will present incredible opportunities for skilled technical traders. You don’t want to miss out on the opportunity these types of big moves present. In fact, last week we closed out 24.16% in profits for the first week of August and you can see the charts here.
Following the core commodities as related to global economic and manufacturing demand and capacity are key elements to understanding how traders and investors are viewing the future expectations for the global markets. Commodities like Copper, Gold, Silver, Oil, Natural Gas, and others can often be leading indicators related to global economic output and expectations. We urge all traders to prepare for a broader market contraction event over the next 6 to 12+ months based on our research that suggests Copper is setting up for a breakdown move.
These global market price swings in 2019 and 2020 are going to be huge events that will present incredible opportunities for skilled technical traders. You don’t want to miss out on the opportunity these types of big moves present.
Recently warning that the next financial crisis (bear market) was scary close, possibly just a couple weeks away. The charts I posted will make you really start to worry. See Scary Bear Market Setup Charts.
I then posted a detailed report talking about where the next bull and bear markets are and how to identify them. This report focused mainly on the SP 500 index and the gold miners index. My charts compared the 2008 market top and bear market along with the 2019 market prices today. See Comparison Charts Here.
On June 26th I posted that silver was likely to pause for a week or two before it took another run up on June 26. This played out perfectly as well and silver is now head up to our first key price target of $17. See Silver Price Cycle and Analysis.
BECOME A TECHNICAL TRADER AND PROFIT LIKE A PRO!
FREE GOLD OR SILVER WITH MEMBERSHIP!
Kill two birds with one stone and subscribe for two years to get your FREE PRECIOUS METAL and get enough trades to profit through the next metals bull market and financial crisis!
Chris Vermeulen
www.TheTechnicalTraders.com
Chris Vermeulen has been involved in the markets since 1997 and is the founder of Technical Traders Ltd. He is an internationally recognized technical analyst, trader, and is the author of the book: 7 Steps to Win With Logic
Through years of research, trading and helping individual traders around the world. He learned that many traders have great trading ideas, but they lack one thing, they struggle to execute trades in a systematic way for consistent results. Chris helps educate traders with a three-hour video course that can change your trading results for the better.
His mission is to help his clients boost their trading performance while reducing market exposure and portfolio volatility.
He is a regular speaker on HoweStreet.com, and the FinancialSurvivorNetwork radio shows. Chris was also featured on the cover of AmalgaTrader Magazine, and contributes articles to several leading financial hubs like MarketOracle.co.uk
Disclaimer: Nothing in this report should be construed as a solicitation to buy or sell any securities mentioned. Technical Traders Ltd., its owners and the author of this report are not registered broker-dealers or financial advisors. Before investing in any securities, you should consult with your financial advisor and a registered broker-dealer. Never make an investment based solely on what you read in an online or printed report, including this report, especially if the investment involves a small, thinly-traded company that isn’t well known. Technical Traders Ltd. and the author of this report has been paid by Cardiff Energy Corp. In addition, the author owns shares of Cardiff Energy Corp. and would also benefit from volume and price appreciation of its stock. The information provided here within should not be construed as a financial analysis but rather as an advertisement. The author’s views and opinions regarding the companies featured in reports are his own views and are based on information that he has researched independently and has received, which the author assumes to be reliable. Technical Traders Ltd. and the author of this report do not guarantee the accuracy, completeness, or usefulness of any content of this report, nor its fitness for any particular purpose. Lastly, the author does not guarantee that any of the companies mentioned in the reports will perform as expected, and any comparisons made to other companies may not be valid or come into effect.
Chris Vermeulen Archive |
© 2005-2022 http://www.MarketOracle.co.uk - The Market Oracle is a FREE Daily Financial Markets Analysis & Forecasting online publication.