Gold Price Trend Validation
Commodities / Gold and Silver Stocks 2019 Aug 22, 2019 - 03:24 PM GMTBy: Denali_Guide
 So who is on First, or Are we there yet ?
Either addresses the current CUT 2 CHASE question.
Blind faith can be good or bad, but tempered with some evidence, might be a good thing. Lets look at several categories of evidence concerning the position and trend of Gold and Gold Stocks.

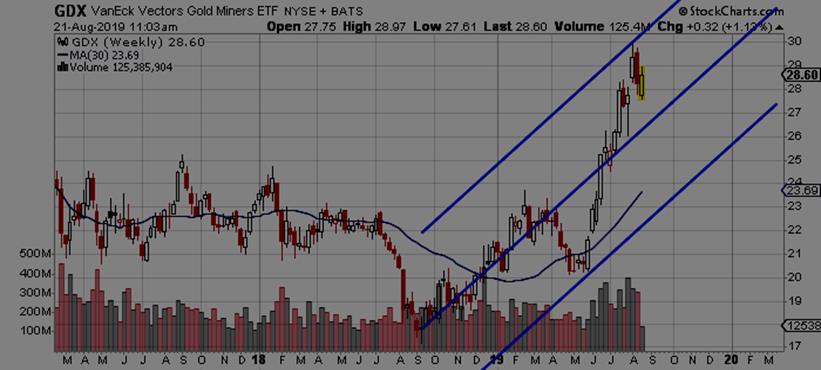
- PRICE & Long Term Trending.
Above the GDX is shown in a 2+ year chart.
Underneath it starting in June is its 30 week Moving Average.
It is bracketed in Blue by an upper and lower limit which define the upper and lower limits of this advance, plus a centerline as a tripwire to determine direction of price
Thus this criteria is positive
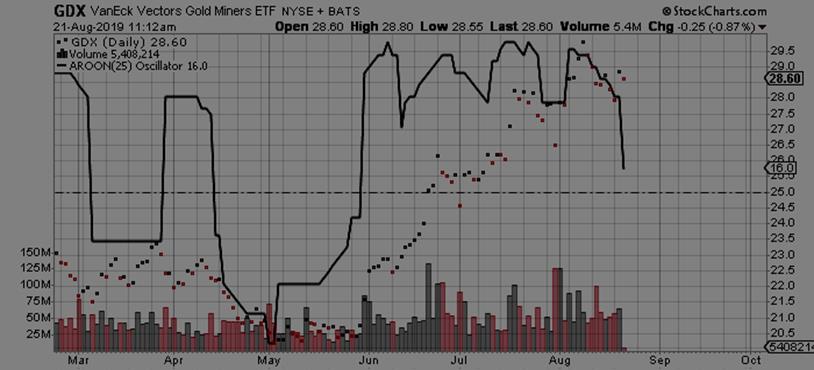
Next are OSCILLATORs
- Directional Oscillators are next, to help us determine direction.
The solid line, Aroon Oscillator, is helpful in determining trend direction, and in this case, climbing down, is indicating a correction down to support is going on now.

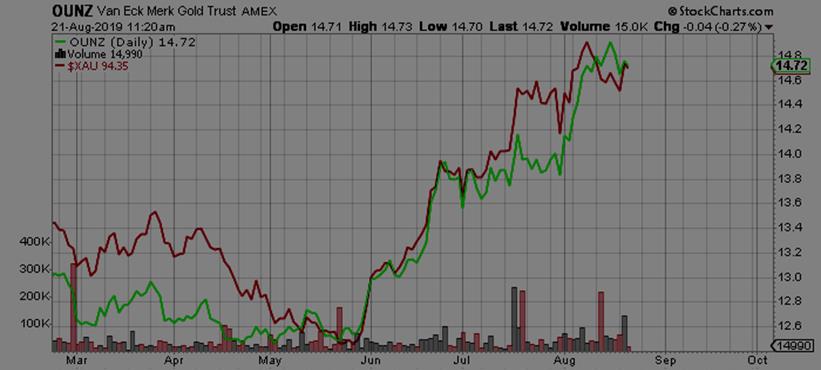
3. Confirmation Measures help us gauge whether two values are in sync. Like the DJ Industrial and the DJ Trans stay in sync, helps us accept their moves. Same for Gold, the Metal and Gold Miners, the Stocks.

In this case, the Mutual Fund OUNZ which can deliver REAL GOLD, and the more conservative Gold Miner Index XAU, are shown together one can see that they are in sync with each other. What that does NOT mean, is that they cannot go down, as they CAN also go down together. It shows this move is valid.

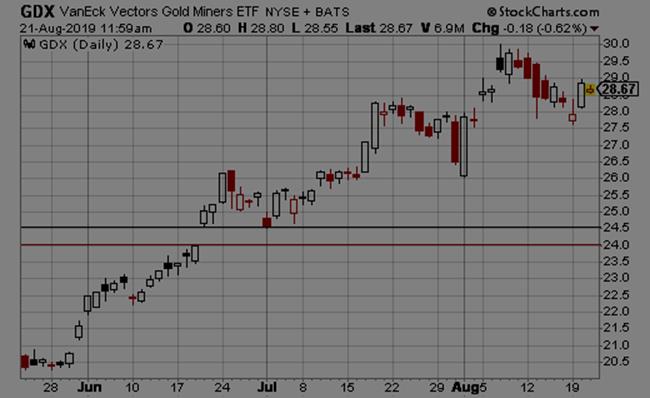
What this analysis leaves me with is the possibility of a sharp drop to fill the gap created on Jun 20, with an Intra-day spike down to the 24.03 level to fill that gap and then a reversal day to the upside, either that day or the next.
That leaves me with HOLDING the stocks I bought in May and June and taking profits in issued without solid relative strength. In any case, the drop will be temporary. Using other measurements, I suspect the gap-filling moves will result in a bounce of the base, and a reversal to the upside between September 1 and October 1.
As an add-back to my Recco's, I remove the AVOID from CCO.To and add it back to Reccos,(CCJ also) as well as adding Denison Mines, DML.To, (DNN), as it seems some Uranium issues have come back to life.
WHEN the GDX or HUI JUMPS the 31-32 gap,( The Straits of Hell ) there will be an amazing show of strength given the Government corruption of the Monetary System. Whether it JUMPS the GAP or merely wades thru it are not as important as WHEN it breaks above the GDX 32 / HUI 300, which has not been seen since July 2013.
Please visit our BLOG at https://denaliguidesummit.com/
CLICK HERE
ONCE A month, our DGS Letter, gives simple and plainly worded summations of the current Analysis with NO Technical Terms, just BUY – SELL – or – HOLD. Unique STOPS and TARGETS with each Recco, and Update as necessary.
Recommendations, Buy or Sell as they happen.
By Denali Guide
http://denaliguidesummit.blogspot.ca
To the the charts involved, go here, to my Public Stock Charts Portfolio, and go to the last section. All charts update automatically. http://stockcharts.com/public/1398475/tenpp/1
© 2019 Copyright Denali Guide - All Rights Reserved
Disclaimer: The above is a matter of opinion provided for general information purposes only and is not intended as investment advice. Information and analysis above are derived from sources and utilising methods believed to be reliable, but we cannot accept responsibility for any losses you may incur as a result of this analysis. Individuals should consult with their personal financial advisors.
© 2005-2022 http://www.MarketOracle.co.uk - The Market Oracle is a FREE Daily Financial Markets Analysis & Forecasting online publication.


