


Stock Market S&P500 Candlestick Pattern On Friday Signals Price Breakdown
Stock-Markets / Stock Markets 2019 Sep 02, 2019 - 12:14 PM GMTBy: Chris_Vermeulen

 As we close out the week and watched the markets trade in a rotational price manner, it became very clear to us that the patterns setting up in price continue to support our overall analysis of the markets and the potential for a bigger downside price move. We issued a call that an August 19th breakdown was expected on or near the trigger date (Aug 19th). We’ve taken some heat from our followers and readers regarding this call and the fact that the markets have yet to really breakdown below current support levels.
As we’ve learned from our experience and previous analysis/calls – the markets can continue to act in ways that run counter to our analysis for much longer and in a much more irrational manner than we can survive the risks associated with any irrational price moves. Yet, at this point, we don’t see anything irrational in the markets – we see opportunity.
Our last few trades for our members have been incredible successes – totaling more than +30% over the past 5 trades. We believe our research team and proprietary price and predictive modeling systems have clearly identified price weakness in the markets. Until price confirms otherwise, our believe is that price will attempt to move lower – establishing new lows. Before we get into the details, be sure to opt-in to our Free Market Forecast and Trade Ideas Newsletter
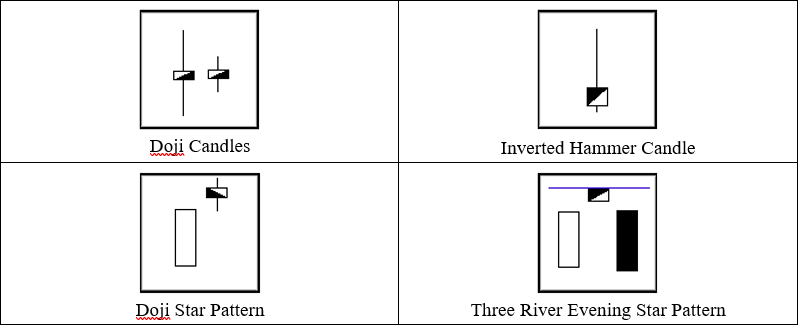
Important Japanese Candlestick Reversal Patterns
The Doji Star and Shooting Star Japanese Candlestick patterns are part of a unique group that identifies potential price reversals, support/resistance and can often build into other types of patterns. Our belief is these setups in the current chart will eventually create an Evening Star formation with a downside price move early next week. This type of pattern would confirm resistance near the body of the current Doji or Shooting Star candlestick and also confirm our analysis that a price breakdown should continue.
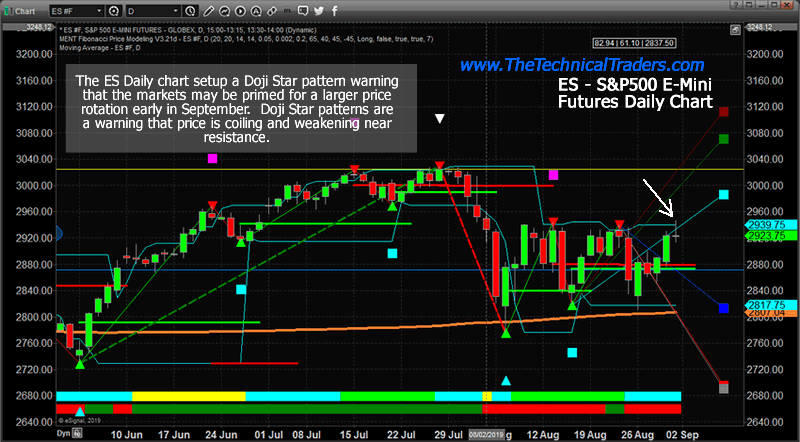
SP500 – ES Daily Chart Highlights the Doji Reversal Pattern
This ES Daily chart highlights the Doji pattern created by the close of Friday trading near 2923.75. The fact that price narrowed on Friday into a Doji pattern forming below the previous highs suggests general weakness in price and a possibility that early next week we may see price breakdown to complete a Harami or Doji Star Reversal Pattern.
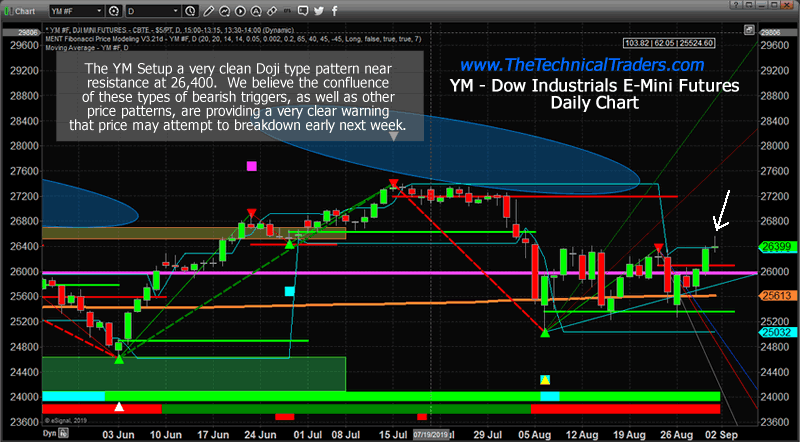
Dow Jones – YM Daily Chart Highlights the Doji Star Reversal Pattern
This YM Daily chart shows a similar pattern – another Doji Star setup. The Doji pattern sets up right at a key resistance level, near 26,400, and aligns with other chart and patterns to warn that price may weaken into a strong Candlestick reversal pattern. All it would take is for the price to move below 26,000 and begin a new downside leg.
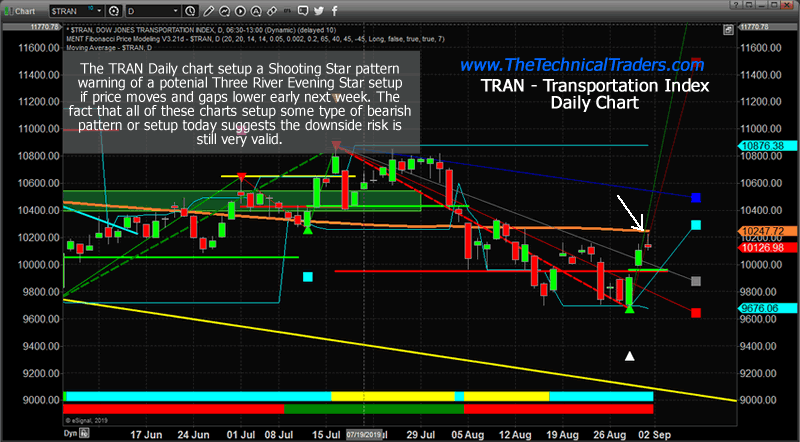
Transportation – TRANS Daily Chart Highlights the Shooting Star Reversal Pattern
This TRAN chart shows a true Shooting Star pattern. The unique shape of the Inverted Hammer candlestick (part of the Umbrella Group) shows clearly. The gap between the last to candlestick bodies sets up the Shooting Star pattern. This is a classic Top Reversal setup. Found at this point in price action suggests price may be set up for a big breakdown. At the very least is shows clear resistance is at 10,130 and that we must be aware that price was rejected at this level.
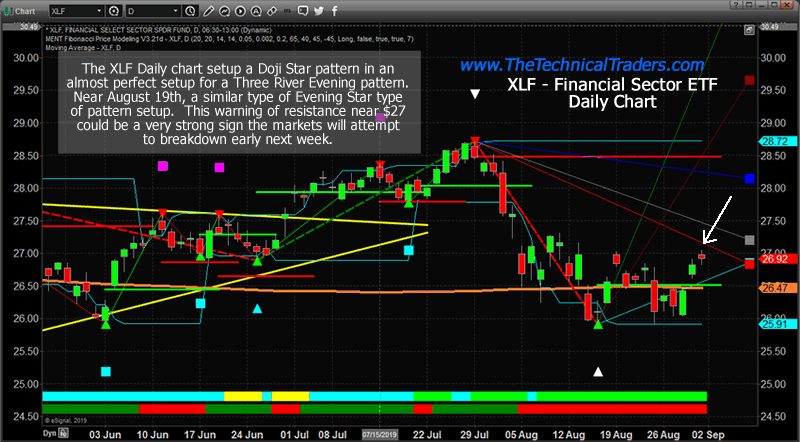
Financials – XLF Daily Chart Highlights the Doji Start Pattern
Lastly, this XLF Daily chart shows a true Doji Star pattern where a Doji candlestick sets up with a gap between the real bodies of the last two candlesticks. Again, this pattern sets up just below $27 which has continued to operate as strong resistance. Any breakdown in this sector early next week will confirm this pattern and set up a Three River Evening Star pattern – a Sell Signal.
CONCLUDING THOUGHTS:
Every one of these patterns provides a clear definition of resistance and also show price weakness set up near the end of last week. At this point, we are just waiting to see what happens early next week after a long holiday weekend. Based on our past research, we believe the downside potential far outweighs the upside potential – unless some major news event pushes the price much higher – like the news of the new US/China trade talks.
We would advise traders and investors to take advantage of these higher prices to pull profits out of open long positions and take some risk off the table at this juncture in price. We entered a new trade today and our portfolio is primed and ready for big moves going into next week.
We believe our super-cycle research and other proprietary modeling systems are suggesting that price weakness will dominate the markets for the next few months. Ride my coattails as I navigate these financial market and build wealth while others lose nearly everything they own during the next financial crisis and recession.
In short, you should be starting to get a feel of where commodities and asset class is headed for the next 8+ months. The next step is knowing when and what to buy and sell as these turning points take place, and this is the hard part. If you want someone to guide you through the next 12-24 months complete with detailed market analysis and trade alerts (entry, targets and exit price levels) join my ETF Trading Newsletter.
FREE GOLD OR SILVER WITH SUBSCRIPTION!
Chris Vermeulen
www.TheTechnicalTraders.com
Chris Vermeulen has been involved in the markets since 1997 and is the founder of Technical Traders Ltd. He is an internationally recognized technical analyst, trader, and is the author of the book: 7 Steps to Win With Logic
Through years of research, trading and helping individual traders around the world. He learned that many traders have great trading ideas, but they lack one thing, they struggle to execute trades in a systematic way for consistent results. Chris helps educate traders with a three-hour video course that can change your trading results for the better.
His mission is to help his clients boost their trading performance while reducing market exposure and portfolio volatility.
He is a regular speaker on HoweStreet.com, and the FinancialSurvivorNetwork radio shows. Chris was also featured on the cover of AmalgaTrader Magazine, and contributes articles to several leading financial hubs like MarketOracle.co.uk
Disclaimer: Nothing in this report should be construed as a solicitation to buy or sell any securities mentioned. Technical Traders Ltd., its owners and the author of this report are not registered broker-dealers or financial advisors. Before investing in any securities, you should consult with your financial advisor and a registered broker-dealer. Never make an investment based solely on what you read in an online or printed report, including this report, especially if the investment involves a small, thinly-traded company that isn’t well known. Technical Traders Ltd. and the author of this report has been paid by Cardiff Energy Corp. In addition, the author owns shares of Cardiff Energy Corp. and would also benefit from volume and price appreciation of its stock. The information provided here within should not be construed as a financial analysis but rather as an advertisement. The author’s views and opinions regarding the companies featured in reports are his own views and are based on information that he has researched independently and has received, which the author assumes to be reliable. Technical Traders Ltd. and the author of this report do not guarantee the accuracy, completeness, or usefulness of any content of this report, nor its fitness for any particular purpose. Lastly, the author does not guarantee that any of the companies mentioned in the reports will perform as expected, and any comparisons made to other companies may not be valid or come into effect.
Chris Vermeulen Archive |
© 2005-2022 http://www.MarketOracle.co.uk - The Market Oracle is a FREE Daily Financial Markets Analysis & Forecasting online publication.