


The Inverted Yield Curve Is Actually a Good Sign for Stocks
Stock-Markets / Stock Markets 2020 Sep 04, 2019 - 04:29 PM GMTBy: Robert_Ross

 August 14 was the worst day of the year for stocks.
The Dow Jones Industrial Average plunged 800 points in a single day.
The stock market plunged because of a serious economic warning sign called a yield curve inversion.
A yield curve inversion is a canary in the coal mine for the economy. It’s happened before every recession in the last 50 years.
However, there’s no reason to panic.
An inverted yield curve does not mean a recession is imminent. In fact, the last five times the yield curve inverted, stocks actually rose for the next 12–18 months.
Why This Inversion Spooked Investors So Much
When investors talk about the yield curve, they’re talking about the difference between long-term Treasury yields and short-term Treasury yields.
Normally, investors demand higher yields for longer-term bonds. So the yield curve normally slopes upward like this:
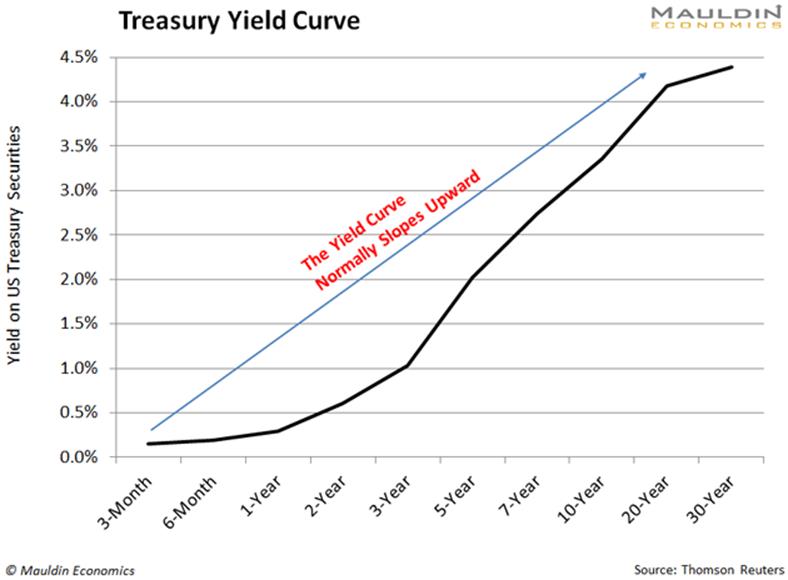
But sometimes, things aren’t so normal.
When one of the long-term Treasuries yields less than one of the short-term Treasuries, it’s called a yield curve inversion.
For example, that might mean the yield on 10-year Treasuries is less than the yield on 3-month Treasuries, like it was back in March.
Or it might mean the yield on 10-year Treasuries is less than the yield on 2-year Treasuries.
That’s what happened on August 14: The 10-year yield was 1.59%, and the 2-year yield was 1.60%. So, the difference was -0.01%. (Whenever this number is negative, you’ve got a yield curve inversion.)
The last time this part of the yield curve inverted was in December 2005—two years before the financial crisis.
So it’s pretty rare. That’s why the August 14 inversion spooked investors so much and US stocks suffered their worst day of the year.
A Recession Is Coming, but Not Tomorrow
There’s no way around it: The August 14 inversion means investors expect the economy to slow soon.
Remember, the yield curve has inverted before every recession over the past 50 years.
You can see the inversion shortly before the last three recessions in the next chart. (Yield curve inversions are circled in red, and recessions are highlighted in grey.)
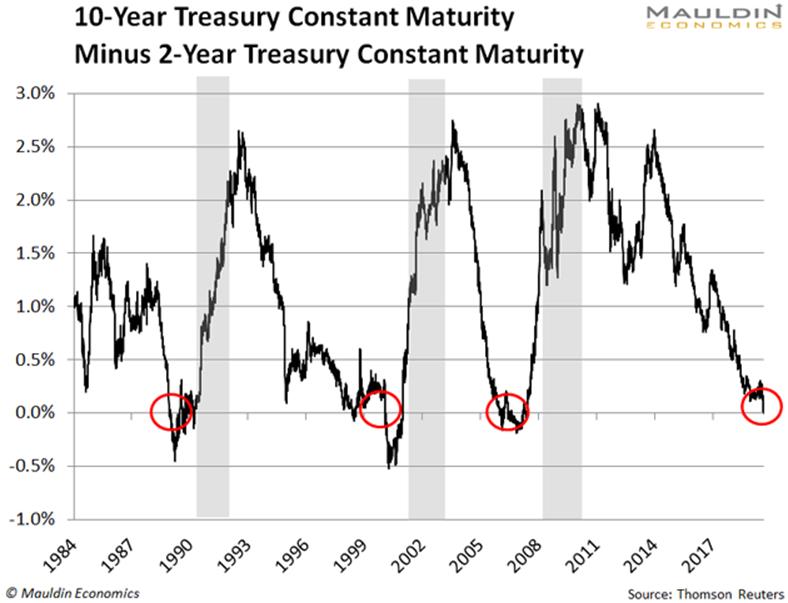
But here’s the thing: Those recessions weren’t immediate. They happened 12 months later, on average.
In other words, we’re probably headed for a recession, but not tomorrow.
The same logic applies to the stock market…
Stocks Could Continue to Climb Until September 2020
The recent yield curve inversion is a positive sign for stocks, at least for now. That’s because the S&P 500 rose significantly after the last three inversions.
You can see this in the table below.
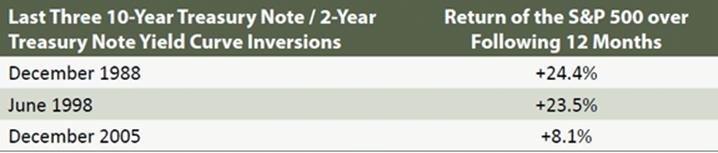
In the 12 months after the last three inversions, the S&P 500 returned an average of 18.7%. Those are major gains equal to the return on the S&P 500 since June 2017.
If the pattern holds, stocks should continue to rise until about September 2020.
This Isn’t the Time for More Risk
History says the stock market should perform well for the next 12 months. But 12 months can go by quickly.
At this point, buying risky stocks is like picking up pennies in front of a steamroller. You might make solid gains at first, then get squashed and lose a big chunk of money.
Most investors take on too much risk anyway, even in normal market conditions. But with the stock market near all-time highs and the recent yield curve inversion, this is truer than ever.
That’s why, if you buy anything, you want to buy safe and reliable dividend-paying stocks.
That means gold royalty companies like Wheaton Precious Metals (WPM).
Investors buy gold when stock market risk rises. So when stocks eventually do hit the skids, gold and gold-linked companies like Wheaton will benefit.
We saw this at the end of last year. When the S&P 500 fell 15% from September to December, Wheaton Precious Metals rose 23%.
It also means companies like Walmart (WMT).
The company has a growing stronghold in the surging e-commerce market, and its stock is safe. Case in point, when the S&P 500 fell 20% at the end of 2018, Walmart's share price actually increased.
That’s exactly the type of company you want to own right now.
Last on my list is CME Group (CME).
CME operates the largest futures exchange in the world. Investors buy futures contracts to bet on whether the price of something will rise or fall. When stock prices go up and down a lot, CME sells even more contracts.
In other words, the company actually benefits from a more volatile stock market.
If history is any guide, stocks should continue to climb for the next 12 months or so. Still, whether it comes 6, 12, or 24 months from now, you want to prepare your portfolio for a pullback now.
That means steering clear of risky, overpriced stocks and adding safe and reliable dividend payers like the three I just mentioned.
The Sin Stock Anomaly: Collect Big, Safe Profits with These 3 Hated Stocks
My brand-new special report tells you everything about profiting from “sin stocks” (gambling, tobacco, and alcohol). These stocks are much safer and do twice as well as other stocks simply because most investors try to avoid them. Claim your free copy.
By Robert Ross
© 2019 Copyright Robert Ross. - All Rights Reserved Disclaimer: The above is a matter of opinion provided for general information purposes only and is not intended as investment advice. Information and analysis above are derived from sources and utilising methods believed to be reliable, but we cannot accept responsibility for any losses you may incur as a result of this analysis. Individuals should consult with their personal financial advisors.
© 2005-2022 http://www.MarketOracle.co.uk - The Market Oracle is a FREE Daily Financial Markets Analysis & Forecasting online publication.