


Gold at Support: the Upcoming Move
Commodities / Gold & Silver 2019 Sep 12, 2019 - 01:16 PM GMTBy: P_Radomski_CFA

 Gold and gold stocks declined yesterday, but silver hesitated. Does this, plus the fact that gold is up so far in today’s pre-market trading indicate a short-term bottom? Or is the picture even on the verge of turning bullish?
Not at all. Let’s take a look at the chart below for details.
Yesterday in the PMs
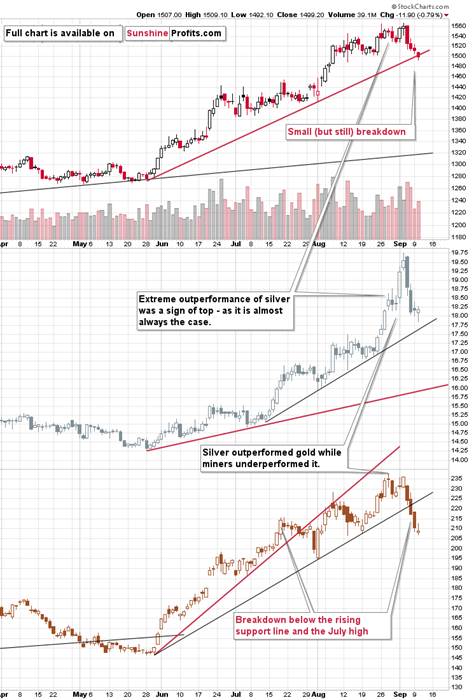
Gold close – and thus broke – below the $1,500 level yesterday. The breakdown was small – less than $1, so the move is definitely not confirmed. At the same time, gold moved to the rising support line but failed to close below it. This support is likely to trigger a rebound and that’s what we’re seeing in today’s trading. So far gold is up by about $7 and we don’t expect the rally to be much bigger than that. Gold’s seasonals don’t point to strength at this time and there are multiple other factors that instead point to the decline’s continuation.
For instance, gold miners just confirmed the breakdown below their rising support line. They also managed to close yesterday’s session below July highs. This is bearish on its own and also through the relationship with gold. Gold miners’ weakness relative to gold tends to herald weakness in the entire precious metals sector.
Does silver’s pause indicate any strength here? No. It declined sharply, so a daily breather is very natural, and it doesn’t imply anything.
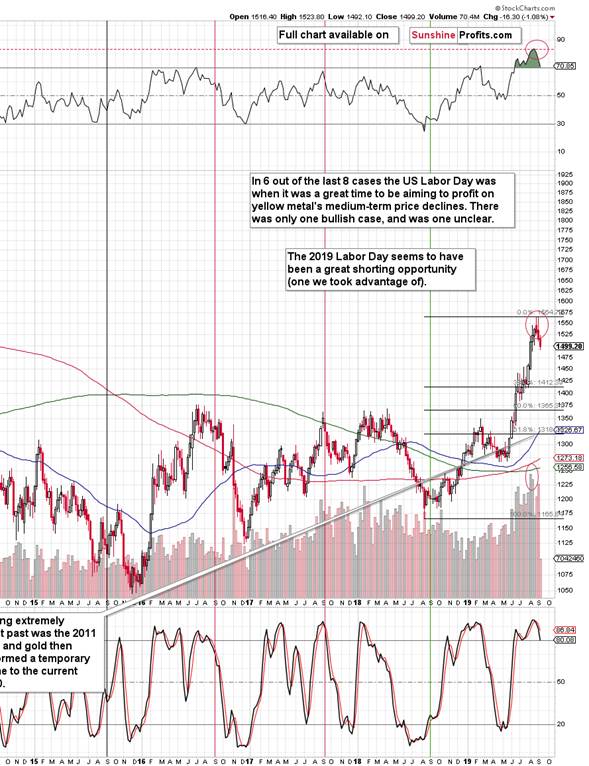
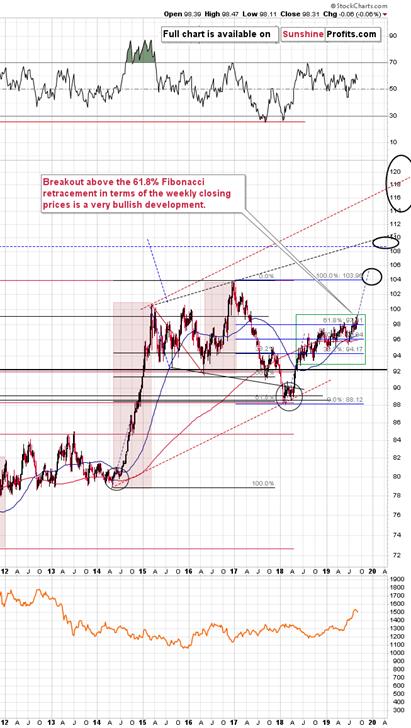
Taking a bigger perspective, we see how gold declined after two big-volume weekly reversals. Gold declined shortly after the U.S. Labor Day – just like we expected it to, and just like it was the case in 2011 and in most years between 2011 and now.
The weekly RSI is still above 70 suggesting that even the very initial part of the decline is not yet over. This is another reason to think that the current bounce in gold is going to be short-lived.
The USD Index, Correlation Matrix and Gold
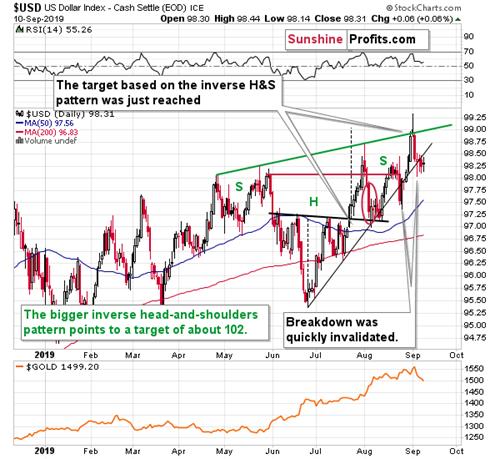
Meanwhile, the USD Index hasn’t done much yesterday, and it was the second daily close below the rising support line. This means that the breakdown below it might be confirmed and USD could decline some more before rallying again.
However, since gold hasn’t moved in tune with the USD Index recently – gold declined on its own – a small move lower in the USDX might not trigger any important upswings in gold. Let’s take a look at our Correlation Matrix for details.
The correlation coefficient between gold and the USD Index for the past 30 days is 0.25 which is close to 0. This means that there has been barely any correlation between the two. In the short run.
Interestingly, in case the very long-term (1500 trading days – about 6 years), the correlation values are negative in case of all parts of the precious metals market – gold, silver, HUI Index, and junior mining stocks (as represented by the TSX Venture Index). These values become more negative on average in case of even more long-term values. What does this imply? That while the short-term moves might be unrelated, gold and the rest of the PM market is very unlikely to ignore a massive long-term move in the currency market.
And you know what? Such a move – up – is just around the corner. In fact, it’s already underway, but it’s not clear for everyone that it is indeed the case.
The above chart shows that in general, when the USD Index was moving down (between 2001 and 2011), gold was moving up, and when it moved up (between 2011 and now), gold moved down.
Zooming out allows us to see two more things:
- The USD Index is after an enormous breakout and the entire 2017-2018 decline was just a post-breakout correction
- There were two major rallies in the USDX – in early 80s and in late 90s.
Based on point 1, we can infer that yet another major long-term rally in the USD is unfolding, and based on point 2, we can infer what gold is likely to do in such environment.
The ellipses mark moments when the USD Index was starting its rally. What happened in gold? Despite its previous strength, it turned around and declined. And it didn’t decline for just a week or month – it continued to decline until its price was severely lower.
Consequently, while a quick move lower in the USD might not change much, the long-term rally that is likely to unfold in the following months is very likely to contribute to much lower gold prices.
Before summarizing, we would like to once again quote the section with links to most important bearish factors that are currently in play:
Key Factors to Keep in Mind
Critical factors:
- The USD Index broke above the very long-term resistance line and verified the breakout above it. Its huge upswing is already underway.
- The USD’s long-term upswing is an extremely important and bearish factor for gold. There were only two similar cases in the past few decades, when USD Index was starting profound, long-term bull markets, and they were both accompanied by huge declines in gold and the rest of the precious metals market
- Out of these two similar cases, only one is very similar - the case when gold topped in February 1996. The similarity extends beyond gold’s about a yearly delay in reaction to the USD’s rally. Also the shape of gold price moves prior to the 1996 high and what we saw in the last couple of years is very similar, which confirm the analysis of the gold-USD link and the above-mentioned implications of USD Index’s long-term breakout.
- The similarity between now and 1996 extends to silver and mining stocks – in other words, it goes beyond USD, gold-USD link, and gold itself. The white metal and its miners appear to be in a similar position as well, and the implications are particularly bearish for the miners. After their 1996 top, they erased more than 2/3rds of their prices.
- Many investors got excited by the gold-is-soaring theme in the last few months, but looking beyond the short-term moves, reveals that most of the precious metals sector didn’t show substantial strength that would be really visible from the long-term perspective. Gold doesn’t appear to be starting a new bull market here, but rather to be an exception from the rule.
- Gold’s True Seasonality around the US Labor Day points to a big decline shortly.
Very important, but not as critical factors:
- Long-term technical signs for silver, i.a. the analogy in terms of price to what we saw in 2008, shows that silver could slide even below $10.
- Silver’s very long-term cycles point to a major reversal taking place right now and since the most recent move was up, the implications are bearish (this is also silver’s technical sign, but it’s so important that it deserves its own point)
- Long-term technical signs for gold stocks point to this not being a new gold bull market beginning. Among others, it’s their long-term underperformance relative to gold that hint this is rather a corrective upswing within a bear market that is not over yet.
- Record-breaking weekly volume in gold is a strong sign pointing to lower gold prices
Important factors:
- Extreme volume reading in the SIL ETF (proxy for silver stocks) is an effective indication that lower values of silver miners are to be expected
- Silver’s short-term outperformance of gold, and gold stocks’ short-term underperformance of gold both confirm that the precious metals sector is topping here
- Gold topped almost right at its cyclical turning point, which makes the trend reversal more likely
- Copper broke below its head-and-shoulders pattern and confirmed the breakdown. The last time we saw something similar was in April 2013, when the entire precious metals sector was on the verge of plunging lower.
Moreover, please note that while there may be a recession threat, it doesn’t mean that gold has to rally immediately. Both: recession and gold’s multi-year rally could be many months away – comparing what happened to bond yields in the 90s confirms that.
In particular, it’s worth keeping in mind the enormous potential of the USD Index. It’s after a major breakout in 2014/2015 and three verifications thereof. The 2017-2018 decline which seems huge on its own, was just a verification of a much bigger (and thus more important) pattern.
Summary
Summing up, the big decline in the precious metals sector appears to be finally underway as gold and silver are plunging even without a rallying USD Index. And the PMs’ decline started right after the U.S. Labor Day, as we have described. Once the USDX takes off, it will likely serve as fuel to the fire-like decline that’s already underway. The similarity to mid-90s continues to support much lower gold prices in the following months, and the True Seasonal patterns continues to favor lower gold prices in the following weeks. All in all, it seems that what we see right now is the beginning of the final stage of the prolonged decline in the precious metals sector that started in 2011. On a short-term basis, it seems that we might get some temporary strength once gold moves to about $1,330 – perhaps within the next few weeks.
Today's article is a small sample of what our subscribers enjoy on a daily basis. Check more of our free articles on our website, including this one – just drop by and have a look. We encourage you to sign up for our daily newsletter, too - it's free and if you don't like it, you can unsubscribe with just 2 clicks. You'll also get 7 days of free access to our premium daily Gold & Silver Trading Alerts to get a taste of all our care. On top, you’ll also get 7 days of instant email notifications the moment a new Signal is posted, bringing our Day Trading Signals at your fingertips. Sign up for the free newsletter today!
Thank you.
Przemyslaw Radomski, CFA
Founder, Editor-in-chief
Tools for Effective Gold & Silver Investments - SunshineProfits.com
Tools für Effektives Gold- und Silber-Investment - SunshineProfits.DE
* * * * *
About Sunshine Profits
Sunshine Profits enables anyone to forecast market changes with a level of accuracy that was once only available to closed-door institutions. It provides free trial access to its best investment tools (including lists of best gold stocks and best silver stocks), proprietary gold & silver indicators, buy & sell signals, weekly newsletter, and more. Seeing is believing.
Disclaimer
All essays, research and information found above represent analyses and opinions of Przemyslaw Radomski, CFA and Sunshine Profits' associates only. As such, it may prove wrong and be a subject to change without notice. Opinions and analyses were based on data available to authors of respective essays at the time of writing. Although the information provided above is based on careful research and sources that are believed to be accurate, Przemyslaw Radomski, CFA and his associates do not guarantee the accuracy or thoroughness of the data or information reported. The opinions published above are neither an offer nor a recommendation to purchase or sell any securities. Mr. Radomski is not a Registered Securities Advisor. By reading Przemyslaw Radomski's, CFA reports you fully agree that he will not be held responsible or liable for any decisions you make regarding any information provided in these reports. Investing, trading and speculation in any financial markets may involve high risk of loss. Przemyslaw Radomski, CFA, Sunshine Profits' employees and affiliates as well as members of their families may have a short or long position in any securities, including those mentioned in any of the reports or essays, and may make additional purchases and/or sales of those securities without notice.
Przemyslaw Radomski Archive |
© 2005-2022 http://www.MarketOracle.co.uk - The Market Oracle is a FREE Daily Financial Markets Analysis & Forecasting online publication.