


The Many Aligning Signals in Gold
Commodities / Gold & Silver 2019 Oct 15, 2019 - 04:10 PM GMTBy: P_Radomski_CFA

 Precious metals moved strongly on Friday, and did so on significant volume. The reversals we have seen on Thursday got resolved with a heavy thud. Let’s dive into the many charts and perspectives and explore how well they support the upcoming move across the sector.
Let’s start this week with a bigger update on multiple gold charts. There are so many reasons due to which gold is likely to decline in the following months - we’ll start with last week’s closing day analysis.
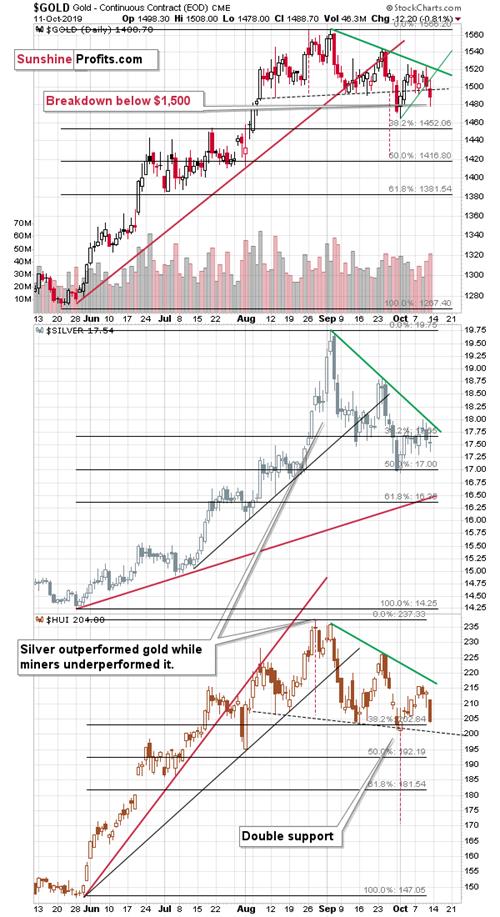
Gold, silver, and mining stocks declined, and the way in which they did, was very informative. Gold closed both the day and the week below the $1,500 level and the volume increased as gold declined. In fact, Friday’s volume was the highest one that we saw so far this month.
And gold stocks’ strength that we saw on Thursday? Gone and invalidated. Friday’s decline in the HUI Index erased almost the entire October upswing. Neither in silver nor in gold have we seen the same kind of weakness. The miners’ underperformance is huge and it serves as a major bearish confirmation.
Of course, that’s just the tip of the signal iceberg.
Let’s consider what gold did in the previous cases when it topped while forming a few lower tops.
The Message of Gold’s Lower Highs
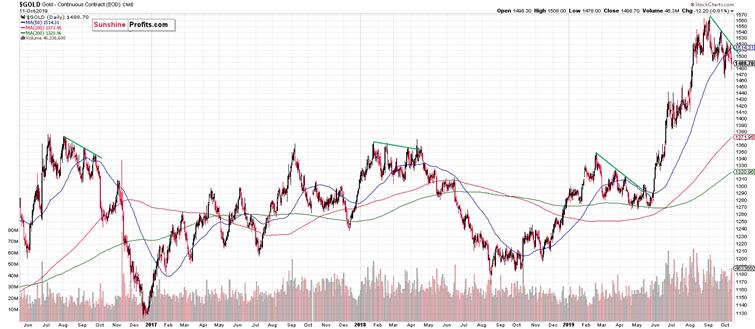
The similar cases are characterized by the declining green lines and the thing that we would like you to focus on is the price of gold compared to the green lines and the 50-day moving average. The latter can be useful for many things, and in this case it’s helpful in determining whether gold declined significantly enough for the move to be the start of a bigger downswing.
There was practically only one case when gold moved above one of its previous highs and it was in 2018. Back then, gold moved to a new high before starting the decline. But where did gold decline before this move? Only slightly below the 50-day moving average and the MA was far from the declining green resistance line.
In 2016 and earlier in 2019 when the declining resistance line moved to the 50-day moving average, and gold declined below the latter, there was no new high and gold’s decline continued. In early 2019, it continued only for some time, but in 2016, it was followed by a major and sharp slide. The latter happened in October, by the way. All in all, it seems more likely than not that the counter-trend upswing is already over. And if it isn’t, then it’s very likely that gold won’t rally to new highs before declining significantly.
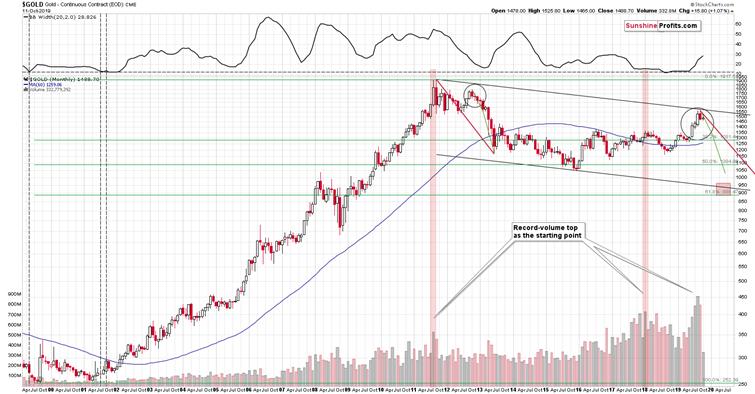
We had written that gold has likely topped in August as it moved up on huge volume. It was hard to believe, due to the same thing that caused the volume to be high in the first place – the extraordinary, emotional bullishness. The same thing accompanied the 2011 high and the 2018 high. Gold declined in September, but it’s unlikely that the decline is over. Both above-mentioned highs were followed by $200+ declines in gold and it doesn’t seem that this time is any different.
To be clear, it is different, but not in a way that would prevent gold from declining at least $200 from the recent high.
The move to which gold’s top and the current decline are particularly similar are the 1996 top and the subsequent slide to the final lows.
Gold’s Analogies
We wrote about it in mid-August, but it’s worth bringing up the most interesting chart from that analysis:
The shape of the decline and the subsequent upswing is very similar to what we saw in previous years. However, that’s not even the most important detail that makes the decline so likely. It’s the USD Index and gold’s link to it.
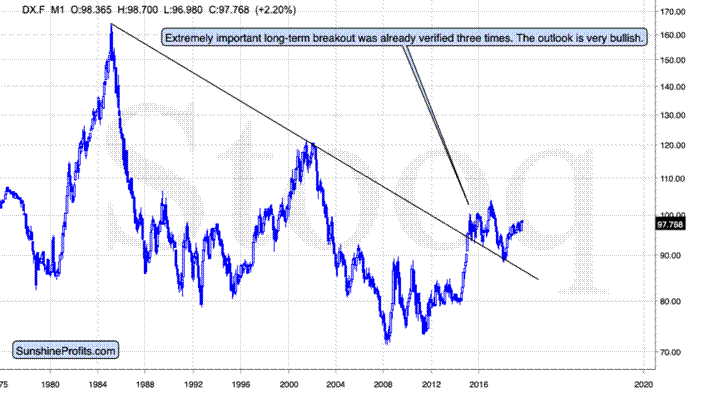
The 2014-2015 rally caused the USD Index to break above the declining very-long-term resistance line, which was verified as support three times. This is a textbook example of a breakout and we can't stress enough how important it is.
The most notable verification was the final one that we saw in 2018. Since the 2018 bottom, the USD Index is moving higher and the consolidation that it's been in for about a year now is just a pause after the very initial part of the likely massive rally that's coming.
If even the Fed and the U.S. President can't make the USD Index decline for long, just imagine how powerful the bulls really are here. The rally is likely to be huge and the short-term (here: several-month long) consolidation may already be over.
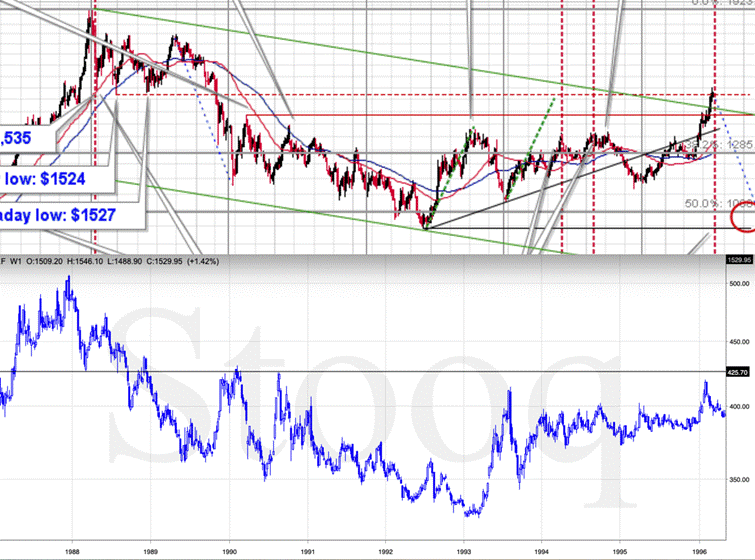
There are two cases on the above chart when the USD Index was just starting its massive rallies: in the early 1980s and in 1995. What happened in gold at that time?
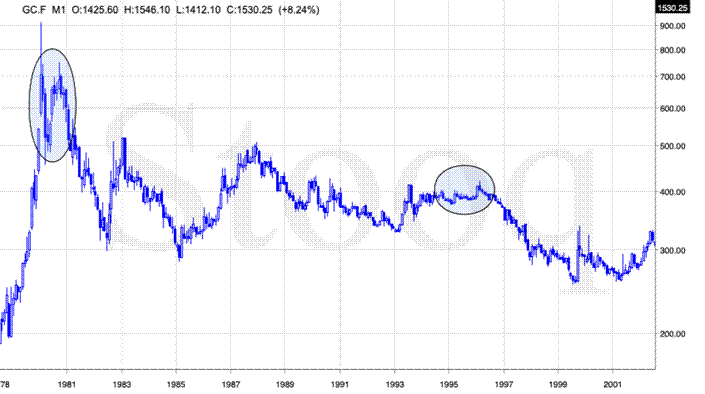
These were the starting points of gold's most important declines of the past decades. The second example is much more in tune with the current situation as that's when gold was after years of prolonged consolidation. The early 1980s better compare to what happened after the 2011 top.
Please note that just as what we see right now, gold initially showed some strength - in February 1996 - by rallying a bit above the previous highs. The USD Index bottomed in April 1995, so there was almost a yearly delay in gold's reaction. But in the end, the USD - gold relationship worked as expected anyway.
The USD's most recent long-term bottom formed in February 2018 and gold [topped in August]. This time, it's a bit more than a year of delay, but it's unreasonable to expect just one situation to be repeated to the letter given different economic and geopolitical environments. The situations are not likely to be identical, but they are likely to be similar - and they are.
What happened after the February 1995 top? Gold declined and kept on declining until reaching the final bottom. Only after this bottom was reached, a new powerful bull market started.
- But gold just rallied so significantly in the last several months!
... And that's most likely what people were saying in early 1995, while they were buying at the top.
It's easy to get carried away by momentum and emotions that it generates. We're here for you to analyze the market as objectively and with as much cold logic as possible. And the key points in gold's supposedly bullish story simply don't add up.
Gold topped on extreme volume in August, just as it did in early 1996. The view from other currencies apart from the U.S. dollar confirms how bearish the outlook really is for the following months. Let’s see the summary for full details.
Summary
Summing up, it seems that the corrective upswing in gold is over or almost over and that the big decline in gold is already underway (and that it had started in August as we had written previously). The invalidation of breakouts above the 2011 high in case of gold priced in the euro and the British pound confirm how bearish the outlook really is for the following months. Gold is likely starting to decline hundreds of dollars. If it rallies a few or even $20 dollars right now, it doesn’t matter much given the above. The profits from the short position in gold, silver and mining stocks are likely to be legendary, but the difficult part is not to miss the decline. That’s why we were so quick to get back to the short position in Friday. It was much better to do so than to risk missing out of this epic move.
Today's article is a small sample of what our subscribers enjoy on a daily basis. They know about both the market changes and our trading position changes exactly when they happen. Apart from the above, we've also shared with them the detailed analysis of the miners and the USD Index outlook. Check more of our free articles on our website, including this one – just drop by and have a look. We encourage you to sign up for our daily newsletter, too - it's free and if you don't like it, you can unsubscribe with just 2 clicks. You'll also get 7 days of free access to our premium daily Gold & Silver Trading Alerts to get a taste of all our care. Sign up for the free newsletter today!
Thank you.
Przemyslaw Radomski, CFA
Founder, Editor-in-chief
Tools for Effective Gold & Silver Investments - SunshineProfits.com
Tools für Effektives Gold- und Silber-Investment - SunshineProfits.DE
* * * * *
About Sunshine Profits
Sunshine Profits enables anyone to forecast market changes with a level of accuracy that was once only available to closed-door institutions. It provides free trial access to its best investment tools (including lists of best gold stocks and best silver stocks), proprietary gold & silver indicators, buy & sell signals, weekly newsletter, and more. Seeing is believing.
Disclaimer
All essays, research and information found above represent analyses and opinions of Przemyslaw Radomski, CFA and Sunshine Profits' associates only. As such, it may prove wrong and be a subject to change without notice. Opinions and analyses were based on data available to authors of respective essays at the time of writing. Although the information provided above is based on careful research and sources that are believed to be accurate, Przemyslaw Radomski, CFA and his associates do not guarantee the accuracy or thoroughness of the data or information reported. The opinions published above are neither an offer nor a recommendation to purchase or sell any securities. Mr. Radomski is not a Registered Securities Advisor. By reading Przemyslaw Radomski's, CFA reports you fully agree that he will not be held responsible or liable for any decisions you make regarding any information provided in these reports. Investing, trading and speculation in any financial markets may involve high risk of loss. Przemyslaw Radomski, CFA, Sunshine Profits' employees and affiliates as well as members of their families may have a short or long position in any securities, including those mentioned in any of the reports or essays, and may make additional purchases and/or sales of those securities without notice.
Przemyslaw Radomski Archive |
© 2005-2022 http://www.MarketOracle.co.uk - The Market Oracle is a FREE Daily Financial Markets Analysis & Forecasting online publication.