


Gold’s Seasonal Outlook for Q4
Commodities / Gold & Silver 2019 Oct 24, 2019 - 08:48 AM GMTBy: Arkadiusz_Sieron

 “What is the best predictor of future behavior? Past behavior.” And while this certainly does not always hold, there is a lesson to be learned from this adage for gold investors. Yup, a saying about behavior might be important for the precious metals market. The basic idea is that behavior can be understood as history here. And so, the best predictor of future developments could be past developments. In other words, past developments might hold some indications as to the fluctuations in the market.
In particular, market patterns might repeat over time. It might just as well be the case that investors behave in a similar manner during specific times in the year. One classic example is the period after New Year – it has been argued that the investors are optimistic at the beginning of the year and that markets could rally then. Another one are the summer doldrums – the old saying is “sell in May and go away” - meaning that people tend to tune out during the summer holidays more than at other times throughout the year. New Year and the summer do not move throughout the year. But Thanksgiving does – it is not always on the same day. The same goes for the market. Some influences could be difficult to pinpoint. The one we focus on is the expiration of derivatives. Futures contracts and options do not always expire on the same day in the month. And so to account for them is slightly more complicated. Even more so if you would like to combine classic seasonal patterns with the expiration of derivatives.
How Seasonality Fits in with Your Investment Process?
Fortunately, we have been able to combine simple seasonality and the impact of derivatives in one form of analysis. So you do not have to pore over hundreds of charts and try to figure out how all the pieces of the seasonality puzzle fit together. And so, you could boost you investment process with the use of our free Gold Seasonality charts.
The main thing to remember about the seasonal charts is that they are a great way to support your investment decisions but they do not replace other forms of analysis. The way to use seasonal charts is to strengthen your trading signals. Another potential use could be to guide you in periods where there are no clear indications from other sources. Seasonality can be useful on its own, but it is at its most useful when combined with other indicators. We highlight the main tenets of the seasonality charts in our seasonality report.
Gold Seasonality
Enough about what seasonality is and how it can boost investments. Let’s get down to the nitty-gritty of the charts. Traditional seasonality calculations are based on the 2002-2019 window and they are augmented by including the expiration of options for the years 2009-2018. The yearly chart is the first one we would like to look at.
The first thing to notice on the chart is that gold tends to go up quite strongly and with relatively little choppiness in the first two months of the year. This fits in quite well with the “January story” but if you take a look at the end of the year, you will notice that the move up actually starts in December, not January, so it might be beneficial to consider a “December-February story.”
The general second point is that starting in late February, the appreciation tends to wane, giving way to a prolonged period of a more choppy nature. This period encompasses June and July, which gives some credit to the “sell in May” story, but the market tends to take off in August rather than September. And so, the summer doldrums might be shorter than commonly believed.
The third phase is the appreciation in the August December period. The market tends to go up but the moves are a lot more volatile than is the case with the early-year appreciation.
This is a relatively wide perspective and it might be interesting to see how it actually played out this year. Please keep in mind that the analogies do not have to perfect – nothing in the markets really is. Let’s take a look at the gold chart for 2018 and 2019 (weekly chart courtesy of http://stockcharts.com).
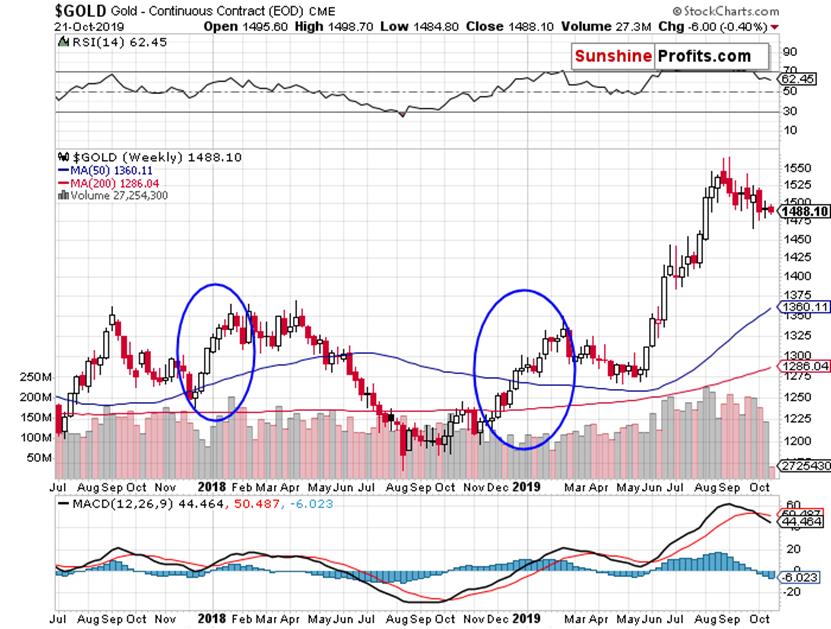
We first call your attention to the turn-of-the year periods. These periods for 2017/18 and 2018/19 are marked with blue ellipses on the chart. As you can see, these are both periods of significant rallies, quite in line with the “December-March” story. Actually, both these periods of appreciation end earlier than would be suggested by seasonality alone but seasonality would have given you quite a nice roadmap to potential market conditions. In particular, it could have strengthened the bullish indications of other forms of analysis.
This was the analogy on the annual time scale. However, in present market conditions, you are probably most interested in what seasonality can tell you now. So, the seasonality chart for Q4 is the one you would be interested in.
The above chart shows that in October gold tends to go up and down a bit, with a pronounced bounce in the middle. And this is approximately what happened in October. The chart also shows that gold could be moving higher in November but the move looks quite choppy. This is the part where it is particularly important to reconcile the indications of seasonality with the indications of of other indicators. This is precisely what we do in our Gold Trading Alerts. Currently, it seems that the indications of seasonality weaken the bearish outlook but not to the point of making the outlook neutral, let alone bullish. Additionally, the seasonality suggests a potential sizable correction in late November/early December. This also suggests that one might want to hold off on bullish moves up at least until that moment. So, together with other market conditions, seasonality currently points to a potential move down in early December. The situation might change, and we monitor market conditions. Stay tuned to our Gold Trading Alerts.
This concludes our second analysis of current seasonal charts. We hope this helps you navigate the market and gain the necessary tools to become successful in this space. You can also read our first seasonal chart analysis.
We hope you have enjoyed this week’s discussion of True Seasonal trading and we invite you to experiment and make these tendencies work for you – our Seasonality charts are freely available right on our website.
We encourage you to sign up for our daily newsletter, too - it's free and if you don't like it, you can unsubscribe with just 2 clicks. If you sign up today, you'll also get 7 days of free access to our premium daily Gold & Silver Trading Alerts. On top of that, you’ll also get 7 days of instant email notifications the moment a new Signal is posted, bringing our Day Trading Signals to your fingertips. Sign up for the free newsletter today!
Regards,
Mike McAra
Bitcoin Trading Strategist
Bitcoin Trading Alerts at SunshineProfits.com
Disclaimer
All essays, research and information found above represent analyses and opinions of Mike McAra and Sunshine Profits' associates only. As such, it may prove wrong and be a subject to change without notice. Opinions and analyses were based on data available to authors of respective essays at the time of writing. Although the information provided above is based on careful research and sources that are believed to be accurate, Mike McAra and his associates do not guarantee the accuracy or thoroughness of the data or information reported. The opinions published above are neither an offer nor a recommendation to purchase or sell any securities. Mr. McAra is not a Registered Securities Advisor. By reading Mike McAra’s reports you fully agree that he will not be held responsible or liable for any decisions you make regarding any information provided in these reports. Investing, trading and speculation in any financial markets may involve high risk of loss. Mike McAra, Sunshine Profits' employees and affiliates as well as members of their families may have a short or long position in any securities, including those mentioned in any of the reports or essays, and may make additional purchases and/or sales of those securities without notice.
Mike McAra Archive |
© 2005-2022 http://www.MarketOracle.co.uk - The Market Oracle is a FREE Daily Financial Markets Analysis & Forecasting online publication.