


Are Precious Metals Beginning Another Rally Attempt?
Commodities / Gold & Silver 2019 Nov 02, 2019 - 04:45 PM GMTBy: Chris_Vermeulen

 Recently, the US stock market rallied to new all-time highs which prompted an almost immediate celebration. A day later, the US stock markets reacted by setting up multiple top rotation patterns. The next day, a moderate price rally set up after the US Fed decreased rates by 25 basis points. The next day, the markets sold off dramatically with heavier volume – prompting the metals and the VIX to rally.
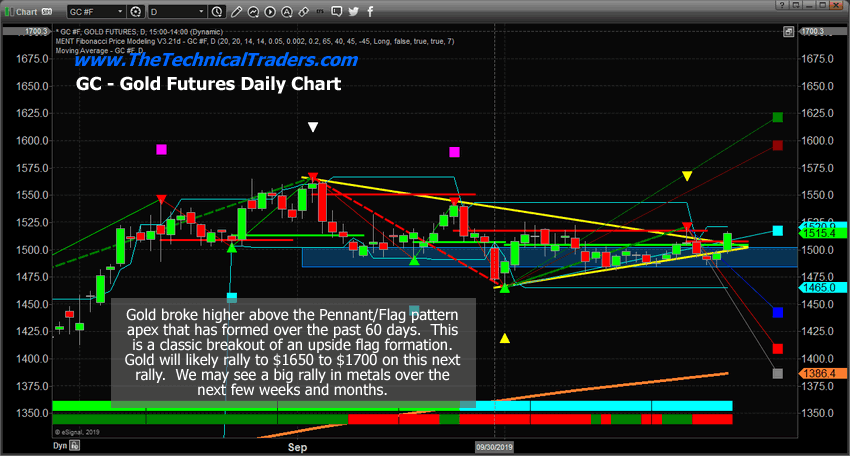
We’ve been warning for weeks that the US markets were setting up into a Pennant/Flag formation within a tightening range biased to the upside. See our index trend analysis signals here. We believe the move in precious metals today may be indicative of a breakout/breakdown move in the markets – near the apex of the pennant formation on the Gold chart, below.
We believe this Pennant/flag formation on the Daily Gold chart aligns with the longer-term pennant formation that setup in the US stock market. We believe the breakout move in metals may be a very strong indication that the US stock market may begin a reversion price move, a deeper downside price rotation, that may result in a spike in the VIX and metals while the US, and potentially global, stock markets react to weakness that may drive a price correction over the next few weeks. This type of price correction may be just like the correction that happened near the end of 2018.
As we’ve been warning over the past few weeks, we believe the US and global stock markets are setting up in a very fragile price pattern. One that may result in a moderately deep price correction that may surprise investors over the next few weeks and months. Be prepared for some very large volatility and an increased risk of a potentially very deep price correction over the next 60 to 120+ days.
If gold continues as we suspect, a rally to the $1600 to $1650 level may be seen very quickly. Ultimately, this rally may continue to levels above $1700 to $1750 before the end of 2019. The speed of the rally in metals will relate to the amount of fear generated by any weakness in the global markets and the speed and severity of potential price collapse.
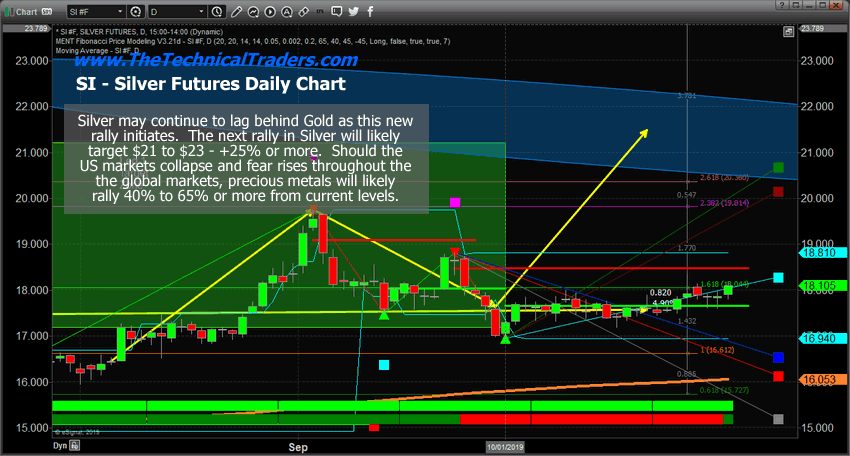
Silver, which should lag behind Gold initially, may see one of the biggest rallies drive prices well above $22 to $23 on the initial upside move – we may just have to wait for it to accelerate as Gold will likely lead this rally.
At this point, price is the true indicator. Technical analysis, price patterns, price theory, and other resources allow us to better understand what is likely to happen in the future. Any price failure after the US stock market reached these nominal new highs will prompt an attempt to retest recent price lows. This means the US stock market may attempt to retest the June 2019 lows or the December 2018 lows on deep price correction.
Read some of our past research posts to understand why this setup is so important for all traders to understand. Failure at this level could be a critical top formation that pushes the markets into a new trend.
October 29, 2019: LONG-TERM PREDICTIVE SOFTWARE SUGGESTS VOLATILITY MAY SURGE
October 20. 2019: BLACK MONDAY 1987 VS 2019 – PART II
September 22, 2019: THE EQUITIES WEDGE AT THE EDGE – FRONT AND CENTER
Concluding Thoughts:
October was the month of most major asset classes completing their consolidation phase. Natural gas was the big mover in October and subscribers and I took full advantage of the consolidation and breakout for a 15-24% gain and its till on fire and ready to rocket higher.
November will be the month of breakouts and breakdowns and should spark some trades. I feel the safe havens like bonds and metals will be turning a corner and starting to firm up and head higher but they may not start a big rally for several weeks or months.
If you like to catch assets starting new trends and trade 1x, 2x and 3x ETF’s the be sure to join my premium trade alert service called the Wealth Building Newsletter.
Chris Vermeulen
www.TheTechnicalTraders.com
Chris Vermeulen has been involved in the markets since 1997 and is the founder of Technical Traders Ltd. He is an internationally recognized technical analyst, trader, and is the author of the book: 7 Steps to Win With Logic
Through years of research, trading and helping individual traders around the world. He learned that many traders have great trading ideas, but they lack one thing, they struggle to execute trades in a systematic way for consistent results. Chris helps educate traders with a three-hour video course that can change your trading results for the better.
His mission is to help his clients boost their trading performance while reducing market exposure and portfolio volatility.
He is a regular speaker on HoweStreet.com, and the FinancialSurvivorNetwork radio shows. Chris was also featured on the cover of AmalgaTrader Magazine, and contributes articles to several leading financial hubs like MarketOracle.co.uk
Disclaimer: Nothing in this report should be construed as a solicitation to buy or sell any securities mentioned. Technical Traders Ltd., its owners and the author of this report are not registered broker-dealers or financial advisors. Before investing in any securities, you should consult with your financial advisor and a registered broker-dealer. Never make an investment based solely on what you read in an online or printed report, including this report, especially if the investment involves a small, thinly-traded company that isn’t well known. Technical Traders Ltd. and the author of this report has been paid by Cardiff Energy Corp. In addition, the author owns shares of Cardiff Energy Corp. and would also benefit from volume and price appreciation of its stock. The information provided here within should not be construed as a financial analysis but rather as an advertisement. The author’s views and opinions regarding the companies featured in reports are his own views and are based on information that he has researched independently and has received, which the author assumes to be reliable. Technical Traders Ltd. and the author of this report do not guarantee the accuracy, completeness, or usefulness of any content of this report, nor its fitness for any particular purpose. Lastly, the author does not guarantee that any of the companies mentioned in the reports will perform as expected, and any comparisons made to other companies may not be valid or come into effect.
Chris Vermeulen Archive |
© 2005-2022 http://www.MarketOracle.co.uk - The Market Oracle is a FREE Daily Financial Markets Analysis & Forecasting online publication.