Gold Price Bull Run Trend Analysis
Commodities / Gold & Silver 2019 Nov 25, 2019 - 02:59 PM GMTBy: Nadeem_Walayat
This analysis continues from part 1 (Gold Price Trend Forecast 2019 Current State). The gold price has had a strong bull run this year, breaking out of it's long-term trading range of $1370 to $1150, which propelled the Gold price towards a core target zone of $1500 to $1530 though ahead of the time frame I had in mind therefore putting the gold price into an extremely overbought state. The price action since the peak of $1566 appears corrective and thus should be in preparation for Gold's next leg higher with my long-term target of $1800 as of December 2016 less than 15% away from the most recent high of $1566.
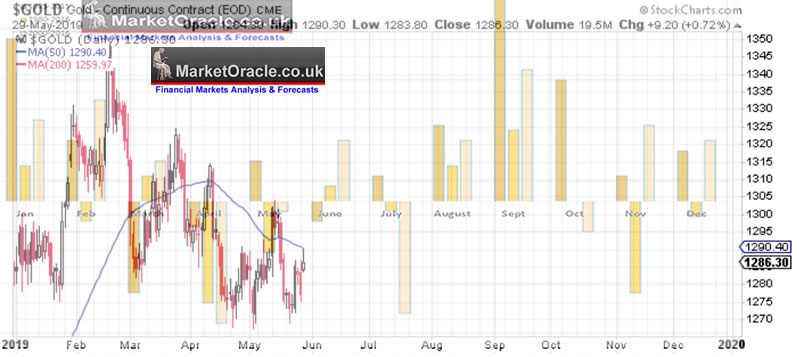
SEASONAL ANALYSIS
Gold peaked early September since which time it's been moving mostly inverse to the seasonal pattern, which therefore implies to expect a volatile but upwards trend during November and likely weak first half of December followed by a rally into early 2020.

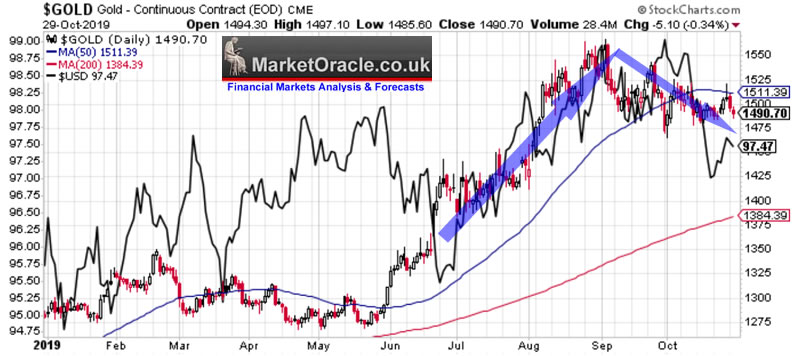
US Dollar
Normally there tends to be an inverse relationship between the US Dollar and Gold. When the Dollar rises, the gold price tends to fall and visa versa.

However, since late June both markets have been trending in tandem, which means that during the June to September rally, Gold was even more overbought that it appeared on the charts. Similarly the Dollar falling during September to October has likely lessened the severity of the correction that Gold would otherwise have experienced.
A quick technical take suggests that the US Dollar should continue to trend lower to target 95.50 which therefore should be supportive of the Gold price.
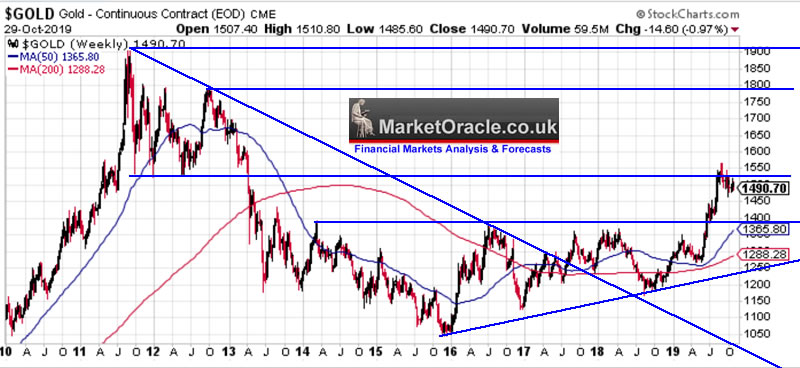
LONG-TERM TREND ANALYSIS

The long-term chart shows Gold hitting resistance at $1530 which has pushed the Gold price back down towards the breakout point of $1390. Which theoretically means the Gold price could correct all the way to around $1400 before an attempt at breaking it's $1566 high, a break of which would likely propel Gold towards my long-term target of $1800.
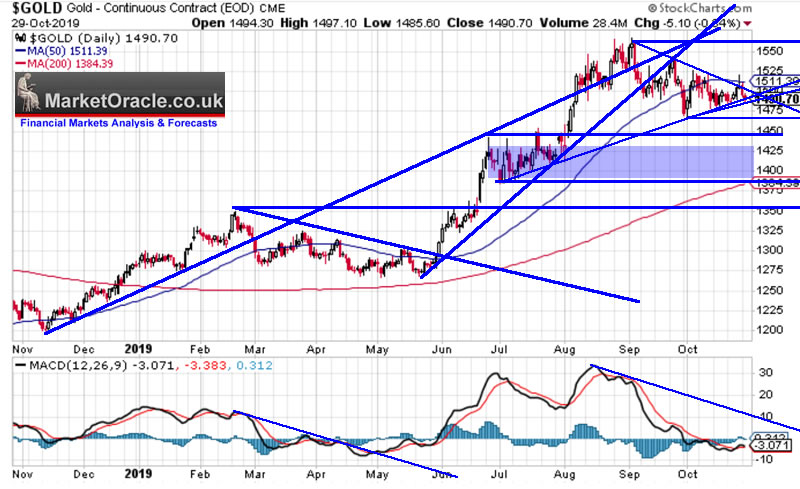
Trend Analysis

The shallow trend lower since the $1566 peak looks corrective so once the correction is over the Gold price should target another attempt at breaking above resistance of $1566. In fact the current price action is reminiscent of the Feb to May correction that set the market up for its summer rally. Though maybe that would be a little too obvious i.e. to expect the market to repeat what it did following the Feb to May correction just because the patterns look very similar.
MACD - The MACD shows that the Gold price has unwound all of its earlier overbought state and is ready to resume it's bull run.
RESISTANCE : There are a string of overhead resistance levels all the way to the $1566 peak.
SUPPORT : Immediate support is at the recent low of $1478, then in the zone of $1435 to $1385. So if $1478 breaks then we are likely to see the Gold price trade in the $1435 to $1385 zone.
Gold Price Forecast Conclusion - Nov - Dec 2019
The rest of this analysis that concludes in a detailed trend forecast into the end of 2019 has first been made available to Patrons who support my work.Gold Price Trend Forecast - Nov to Dec 2019
So for immediate first access to ALL of my analysis and trend forecasts then do consider becoming a Patron by supporting my work for just $3 per month. https://www.patreon.com/Nadeem_Walayat.
Scheduled Analysis
- UK General Election Analysis and Forecasts
- Machine Intelligence Investing stocks sub sector analysis
- Stock Market Trend Forecast
- Gold / Silver Updates
- US Dollar Index
- NASDAQ
- EuroDollar Futures
- EUR/RUB
Recent Analysis includes:
- UK House Prices Momentum General Election Results Forecast
- Learn to Trade - Dow SHORT Risk Vs Reward
- Silver Trend Forecast 2019 Update - Nov to Dec 2019
- Gold Price Trend Forecast - Nov to Dec 2019
- Dow Stock Market Trend Forecast October Update
- Dow Stock Market Trend Forecast Oct to Dec 2019
- Bitcoin Price Analysis and Trend Forecast
- British Pound Trend Forecast vs "Dead in a Ditch" BrExit Civil War General Election Chaos
And ensure you are subscribed to my ALWAYS FREE newsletter for my next in-depth analysis.
Your Analyst
By Nadeem Walayat
Copyright © 2005-2019 Marketoracle.co.uk (Market Oracle Ltd). All rights reserved.
Nadeem Walayat has over 30 years experience of trading derivatives, portfolio management and analysing the financial markets, including one of few who both anticipated and Beat the 1987 Crash. Nadeem's forward looking analysis focuses on UK inflation, economy, interest rates and housing market. He is the author of five ebook's in the The Inflation Mega-Trend and Stocks Stealth Bull Market series that can be downloaded for Free.
 Nadeem is the Editor of The Market Oracle, a FREE Daily Financial Markets Analysis & Forecasting online publication that presents in-depth analysis from over 1000 experienced analysts on a range of views of the probable direction of the financial markets, thus enabling our readers to arrive at an informed opinion on future market direction. http://www.marketoracle.co.uk
Disclaimer: The above is a matter of opinion provided for general information purposes only and is not intended as investment advice. Information and analysis above are derived from sources and utilising methods believed to be reliable, but we cannot accept responsibility for any trading losses you may incur as a result of this analysis. Individuals should consult with their personal financial advisors before engaging in any trading activities.
Nadeem Walayat Archive |
© 2005-2022 http://www.MarketOracle.co.uk - The Market Oracle is a FREE Daily Financial Markets Analysis & Forecasting online publication.


