


Stock Market Range-Bound Into The End Of 2019?
Stock-Markets / Stock Markets 2019 Nov 27, 2019 - 03:15 PM GMTBy: Chris_Vermeulen

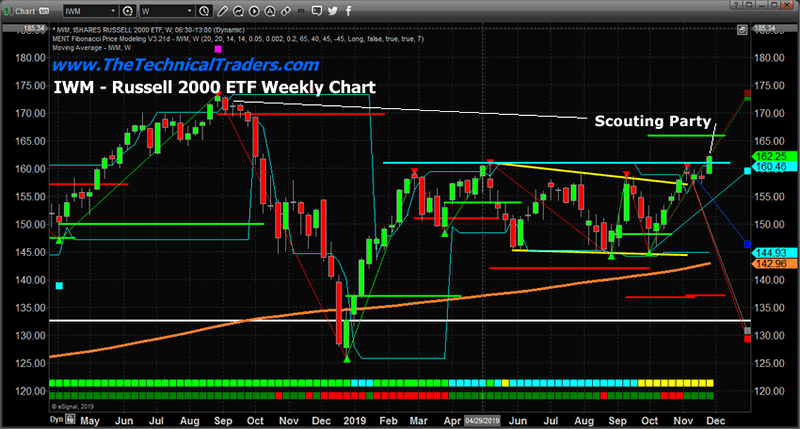
 Two of our favorite charts for following the US markets are suggesting the markets are range bound headed into the end of 2019. The news may continue to push the price higher as the overall bias has continued to be to the upside. Yet, our Fibonacci predictive modeling system is suggesting the current price trend has begun a “scouting party” type of move which may end in a moderate price correction fairly quickly.
IWM Russell 2K Stock Index Chart
Our Adaptive Fibonacci price modeling system is capable of learning from past price activity and attempts to present key price data and trigger levels that are important for future trending. The GREEN and RED horizontal lines on the right edge of this chart shows where the TRIGGER LEVELS are for the Fibonacci system. The bullish trigger level (GREEN) is 2.5% above the current price levels. The bearish trigger level (RED) is nearly 16% below the current price level. This suggests that price would have to target either of these levels to establish a new price trend, or continue rotating within these levels to setup new minor peaks and valleys in the price – thus creating revised TRIGGER LEVELS. Get my updates by joining my free trend signals email list.
What we find interesting is the current “scouting party” type of rally that is taking place on the right edge of this chart. This upside price move is above historical resistance (the CYAN LINE) and appears to be an attempt to test the support levels above the $160.50 level.
If the price is successful in establishing support above this level, a new bullish trend may begin. If not, the price will rotate lower and potentially begin a new bearish price trend. Remember, the downside Bearish Trigger level is 16% below the current price – so that the downside move could be quite dramatic.
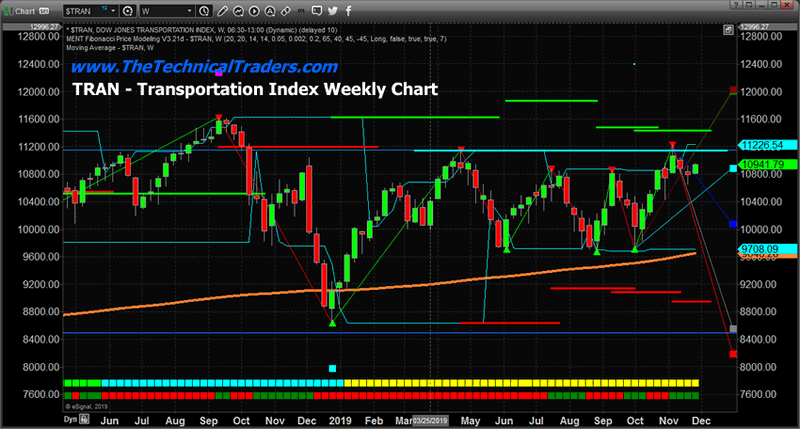
Transportation Index Weekly Chart
This TRAN Weekly chart highlights a similar range-bound price setup where the bullish and bearish Fibonacci TRIGGER LEVELS are well above/below the current price. The upside Bullish Trigger Level is 4.15% above the current TRAN price level – thus price would have to rally at least 4.5% higher to qualify as a breach of this Bullish Trigger Level and qualify as a potential new bullish trend. The Bearish Trigger Level is near 18.4% below the current price level – thus the price would have to fall 18.5% from current levels to breach this Bearish Trigger Level and to qualify as a new Bearish Trend.
Where does this leave us headed into the end of 2019? Our researchers believe the Santa Rally that most traders expect maybe more like a lump of coal in 2019. We don’t expect any big breakout rally to happen over the next 35+ days and we don’t expect a massive 40% price correction either. Our Fibonacci price modeling system is suggesting that any rotation within this 20% price range would be considered “absolutely normal” given the ranges that have been set up over the past 2+ years.
Last week we share these charts on the VIX that paint a clear picture of what is likely to unfold in the next week. This current week is one of the strongest months of the year so
Therefore, the downside price move of 6 to 12% would be completely normal. And the upside move of 2~3% from current levels would be completely normal. Any price rotation within the GREEN/RED Fibonacci triggers levels would be considered “normal price rotation” given the established price ranges, peaks and valleys.
We’ve been saying for months, 2019 and 2020 are certainly going to be interesting years for traders. We believe any price rotation or breakout could lead to a wide range of price rotation that may shock skilled technical traders. At this point, a 22%+ “normal” price range has setup in the markets. Prices could rotate within this range and “not really go anywhere” in technical terms.
I want to wish everyone a Happy Thanksgiving and if you find this type of analysis interesting be sure to visit my website and sign up to get both my swing trade and investing ETF trade signals at 41% discount, plus a free bar of silver or gold with my Black Friday Offer Today! Visit: www.TheTechnicalTraders.com
Chris Vermeulen
www.TheTechnicalTraders.com
Chris Vermeulen has been involved in the markets since 1997 and is the founder of Technical Traders Ltd. He is an internationally recognized technical analyst, trader, and is the author of the book: 7 Steps to Win With Logic
Through years of research, trading and helping individual traders around the world. He learned that many traders have great trading ideas, but they lack one thing, they struggle to execute trades in a systematic way for consistent results. Chris helps educate traders with a three-hour video course that can change your trading results for the better.
His mission is to help his clients boost their trading performance while reducing market exposure and portfolio volatility.
He is a regular speaker on HoweStreet.com, and the FinancialSurvivorNetwork radio shows. Chris was also featured on the cover of AmalgaTrader Magazine, and contributes articles to several leading financial hubs like MarketOracle.co.uk
Disclaimer: Nothing in this report should be construed as a solicitation to buy or sell any securities mentioned. Technical Traders Ltd., its owners and the author of this report are not registered broker-dealers or financial advisors. Before investing in any securities, you should consult with your financial advisor and a registered broker-dealer. Never make an investment based solely on what you read in an online or printed report, including this report, especially if the investment involves a small, thinly-traded company that isn’t well known. Technical Traders Ltd. and the author of this report has been paid by Cardiff Energy Corp. In addition, the author owns shares of Cardiff Energy Corp. and would also benefit from volume and price appreciation of its stock. The information provided here within should not be construed as a financial analysis but rather as an advertisement. The author’s views and opinions regarding the companies featured in reports are his own views and are based on information that he has researched independently and has received, which the author assumes to be reliable. Technical Traders Ltd. and the author of this report do not guarantee the accuracy, completeness, or usefulness of any content of this report, nor its fitness for any particular purpose. Lastly, the author does not guarantee that any of the companies mentioned in the reports will perform as expected, and any comparisons made to other companies may not be valid or come into effect.
Chris Vermeulen Archive |
© 2005-2022 http://www.MarketOracle.co.uk - The Market Oracle is a FREE Daily Financial Markets Analysis & Forecasting online publication.