


Technical Analysis Update: Tadawul All Share Index (TASI) - Saudi Arabia ETF (KSA)
Stock-Markets / Saudi Arabia Dec 12, 2019 - 03:40 PM GMTBy: MarketsToday

Summary
- TASI / KSA break out of bull head & shoulders bottom trend reversal pattern.
- Indicates continuation of long-term upward sloping trend channel.
- Key Fibonacci zone targets marked on enclosed charts.
Bullish reversal is indicated as the Tadawul All Share Index (TASI) (Saudi Stock Market) breaks out of a head & shoulders bottom reversal pattern at the start of the week. The pattern formed following the completion of a 78.6% Fibonacci retracement of the near-term downtrend.
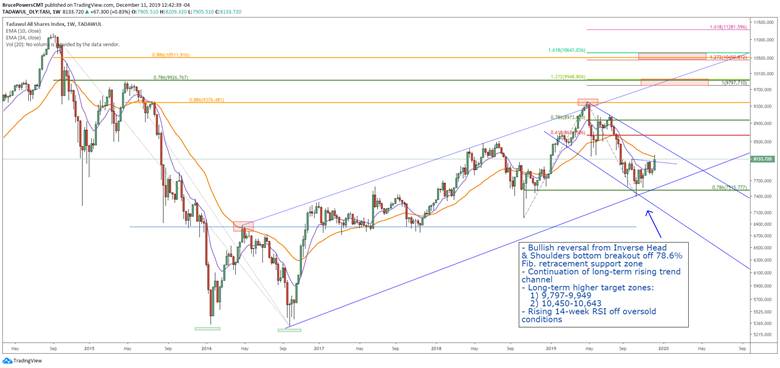
A continuation of a long-term uptrend channel can be anticipated with an eventual rally back to the top of the channel. Fibonacci retracement and projection levels are marked on the enclosed charts to identify potential near and long-term price targets.
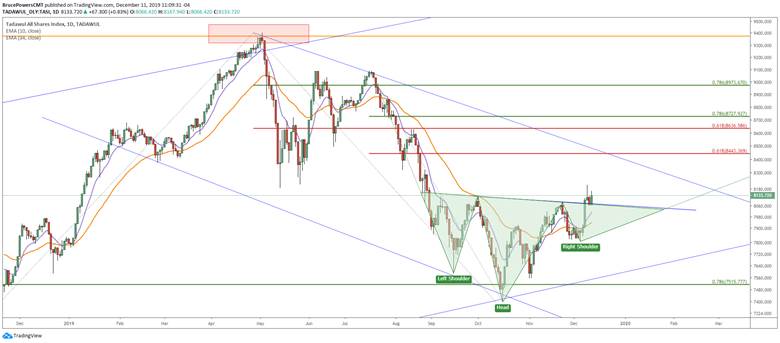
Nevertheless, a decisive daily close below the head at 7,396.60 is a failure of the above bullish scenario, while a daily close below the right shoulder at 7,808.54 puts the bullish scenario at risk and requires a new assessment.
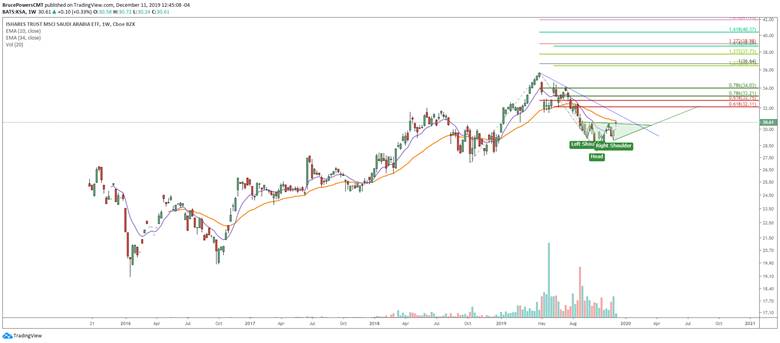
Investors in US markets can access the iShares MSCI Saudi Arabia ETF (KSA) ETF for exposure to the Saudi Arabia stock market. An upside breakout in KSA occurred this week as price closed above $30.56 on a daily basis. Support at the bottom of the right shoulder of the head and shoulders bottom reversal is at $28.97, while the bottom of the head is at $28.04. Fibonacci target levels for KSA are noted on the weekly chart below.
Bruce Powers, CMT
Chief Technical Analyst
http://www.marketstoday.net/
© 2019 Copyright Bruce Powers- All Rights Reserved
Disclaimer: The above is a matter of opinion provided for general information purposes only and is not intended as investment advice. Information and analysis above are derived from sources and utilising methods believed to be reliable, but we cannot accept responsibility for any losses you may incur as a result of this analysis. Individuals should consult with their personal financial advisors.
© 2005-2022 http://www.MarketOracle.co.uk - The Market Oracle is a FREE Daily Financial Markets Analysis & Forecasting online publication.