


US Fed Wooing Inflation
Economics / Inflation Dec 19, 2019 - 07:03 PM GMTBy: Gary_Tanashian

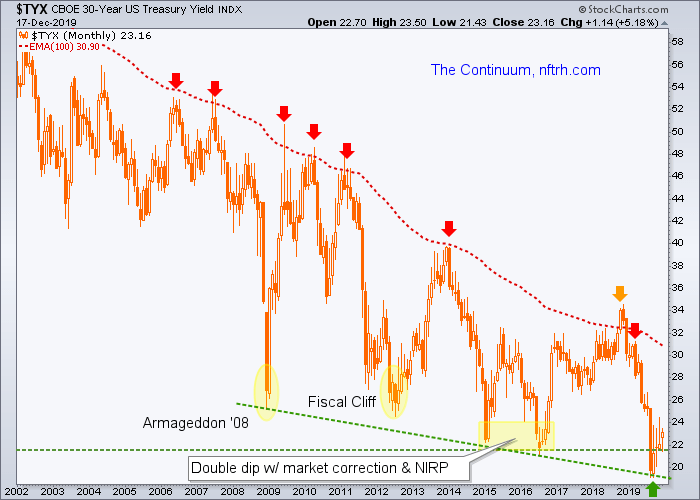
The Continuum (the systematic downtrend in long-term Treasury yields) has for decades given the Fed the green light on inflation. Sometimes it runs hot (as per the red arrows) and sometimes it runs cold. One year ago people were confused about why a declining stock market was not influencing Fed chief Powell to reverse his relatively hawkish tone.
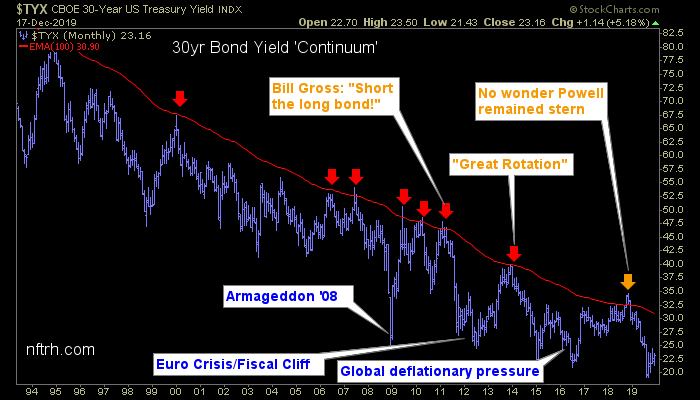
The orange arrow shows exactly why, per this post that will be one year old tomorrow (Dec. 19)…
FOMC at Center Stage (NFTRH 530 Excerpt)
Inflation is what the Fed does, after all. But it needs periodic deflationary episodes in order to keep the racket going. I will stick with my original view that the Fed is not adverse to a market correction or even a bear market. It is exactly what is needed to reload the next inflation gun.
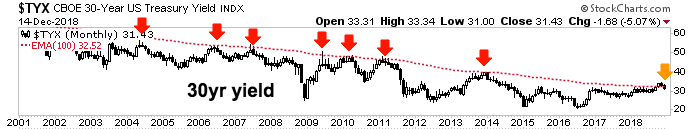
The “BOND BEAR MARKET!!!” stuff ran very hot on this cycle as the 30 year yield broke the Continuum’s limiter (monthly EMA 100) before failing over the last few weeks (to the surprise of many, but not us ;-)). As I have noted previously, in my opinion the Fed does not want a bond bear (breakout in yields) or its running mate, a breakout in inflation expectations because the Fed is an inflation machine. But it has inflated against this pleasant continuum of declining yields over the decades that has encompassed the entire training of most of us as market participants.
I am not saying that a red dashed line is the be all end all of market analysis. But it is a marker that we have used in NFTRH since 2008 in order to correctly interpret the macro situation. My interpretation today is that the Fed has countered the cost-push inflationary pressures that by definition are injected through fiscally (political) stimulative policy by withdrawing liquidity until something breaks. Ironically, that has involved raising the Fed Funds interest rate and withdrawing QE, which theoretically would raise long-term yields. But when something breaks, the risk ‘off’ herds buy the bond driving yields down.
Fast-forward to today. The herds bought the bond alright; they bought it for most of 2019 amid ‘trade war!!’ and ‘inverted yield curve!!’ headlines and associated economic fears. And so the Continuum dropped again, along with inflation concerns and logically, the Fed’s hawkishness after the Q4 2018 orange alert.
We used this chart earlier in the year to gauge the end of the plunge in yields and the bull bond hysteria going in the opposite direction to 2018’s bear bond hysteria. In order to get the prospect of an ‘inflation trade’ going we asked for TYX to rise above 2.2%, and there it is.
The above is only one of several measures of inflation signals but for the illustrative purposes of this post we’ll keep it simple. So far so good with the 30 year yield at 2.3%. Other inflation expectations indicators are also in bounce mode.
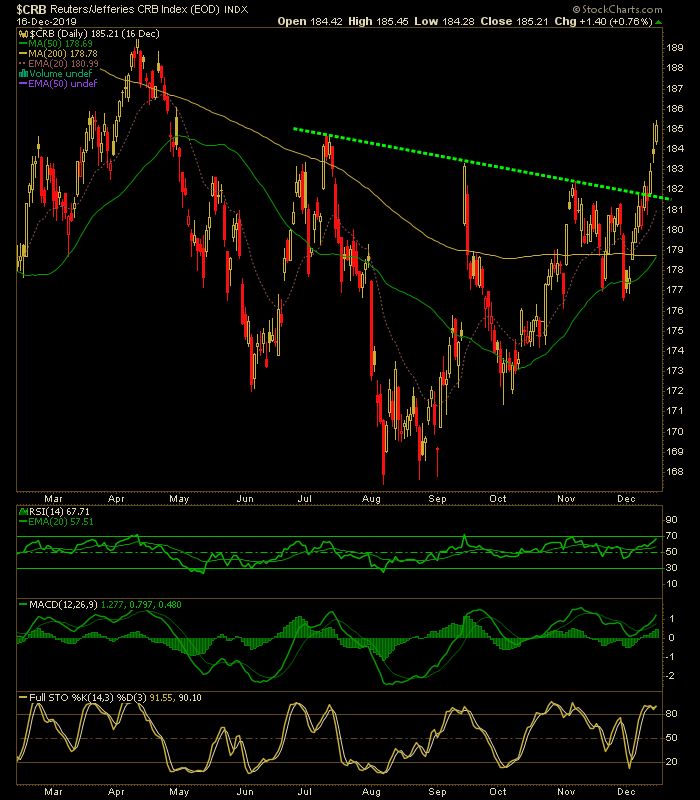
It is no coincidence that the CRB index has formed a daily chart bottoming pattern for a hearty bounce, at least.
What is interesting is that unlike in 2011 when Ben Bernanke virtually commanded the yield curve to flatten by implementing Operation Twist (selling short-term Treasuries and buying long-term Treasuries), the Fed today appears to be okay with a steepening curve (inflation is one condition under which the curve can steepen; the other being liquidity flight and/or deflation) as it focuses on purchasing short-term instruments. From Barrons…
The Fed Would Consider Buying Other Short-Term Treasuries if Necessary, Powell Says
The Federal Reserve would consider buying short-maturity coupon-bearing Treasuries at the end of this year if financing pressures hinder the central bank’s ability to administer its interest-rate policy, Fed Chairman Jerome Powell said Wednesday.
That would be an expansion of the Fed’s current bill-buying efforts. The central bank is increasing the amount of cash reserves in the financial system by buying Treasury bills, which don’t carry coupons. Powell also highlighted that money markets have been stable in recent weeks, so there is no sign that such a change would be needed.
He says there is no sign such a change would be needed, but if needed… like any modern central banker he’s keeping his toolbox close by.
I was prompted to write this post after reading a piece at MarkeWatch…
The Fed should be careful when it wishes for more inflation
The Federal Reserve has been trying, without much success, to raise the inflation rate to its 2% target ever since the central bank designated an explicit target in 2012.
2012 just happens to have been a year of what was then an all-time low in yields on the Continuum charts above. We have sunk to new lows since and pinged upward to lower highs. The Continuum’s downward sojourn is the picture of the “great moderation” as the MarketWatch article calls the post-1970s decades. It is also a potential deflationary whirlpool that the Fed and other central banks doggedly try not to allow the inflated mess known as the global economy to circle the drain into.
Bearing in mind that the CRB index and most commodities and resources are on a good bounce (we have our upside CRB target) but not in anything resembling a significant new bull market, we can enter 2020 on the commodities and resources bull, along with associated global trades. But people should remain aware of the 100 month EMA (red solid and dashed lines) on the TYX charts above. I call it the limiter for a reason and until it proves otherwise by failing to constrain the yield (always a possibility for massive paradigm shift), that is what it is, as was most recently proven one year ago.
Let’s touch base in another year and see how things have worked out.
Subscribe to NFTRH Premium (monthly at USD $33.50 or a 14% discounted yearly at USD $345.00) for an in-depth weekly market report, interim market updates and NFTRH+ chart and trade setup ideas, all archived/posted at the site and delivered to your inbox.
You can also keep up to date with plenty of actionable public content at NFTRH.com by using the email form on the right sidebar and get even more by joining our free eLetter. Or follow via Twitter ;@BiiwiiNFTRH, StockTwits or RSS. Also check out the quality market writers at Biiwii.com.
By Gary Tanashian
© 2019 Copyright Gary Tanashian - All Rights Reserved
Disclaimer: The above is a matter of opinion provided for general information purposes only and is not intended as investment advice. Information and analysis above are derived from sources and utilising methods believed to be reliable, but we cannot accept responsibility for any losses you may incur as a result of this analysis. Individuals should consult with their personal financial advisors.
Gary Tanashian Archive |
© 2005-2022 http://www.MarketOracle.co.uk - The Market Oracle is a FREE Daily Financial Markets Analysis & Forecasting online publication.