


Stock Market What To Expect In Early 2020
Stock-Markets / Stock Markets 2020 Jan 02, 2020 - 11:24 AM GMTBy: Chris_Vermeulen

The US stock market has recently rallied throughout most of the last year after the very deep downside price rotation in late 2018. Our researchers believe there is a very high likelihood of this trend continuing in early 2020, yet we would need to see confirmation across various broader indicators before we could determine the strength of this upside price trend.
We warned that a downside price rotation may happen near the end of 2019 – which never really materialized. The August 2019 downside price rotation looked like it may turn into a deeper downside price move, but the news cycle ended that move as the US Fed decreased rates again and the news of a pending US/China trade deal continued to be pushed into the news cycle. Here we are 3+ months later and we really have no US/China trade deal signed yet.
It is hard to argue with the Christmas Rally thinking that investors simply piled into the US stock market near the end of this year expecting prices to continue to rally. Obviously, this happened in 2019 even though our underlying data charts suggest this move was relatively weak. Let’s get into the charts/data to explore why we believe volatility and rotation may be heightened in early 2020.
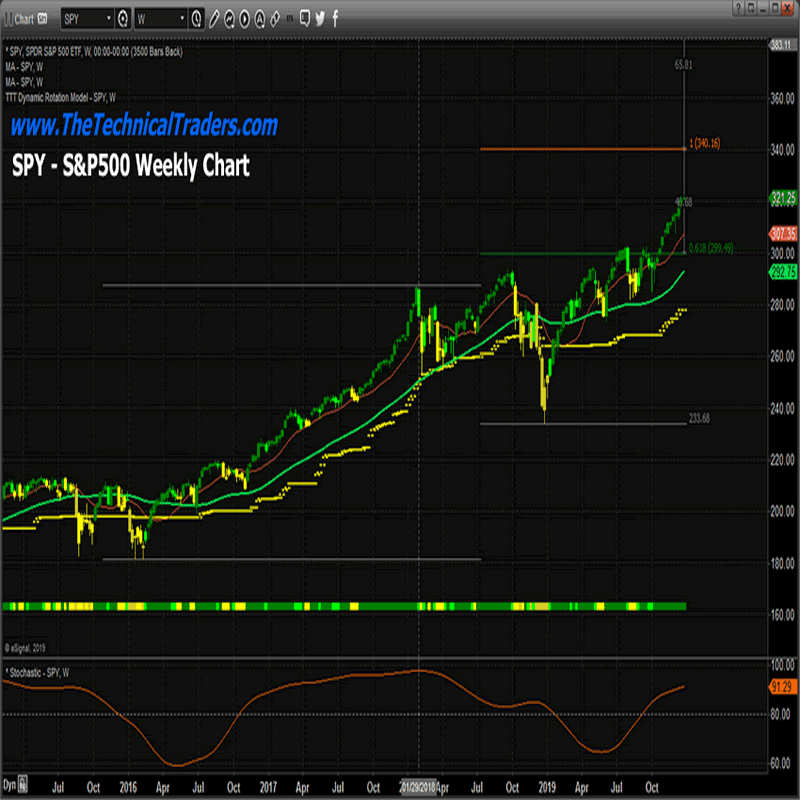
This first chart is a Weekly SPY chart showing one of our proprietary price modeling tools. We can see the longer-term trend is still bullish and that the current upside price rally is nearing the midpoint of the two Fibonacci price expansion levels. Price has been rallying solidly for the past 7+ months with only two minor price retracements in 2019. Will this continue in early 2020?
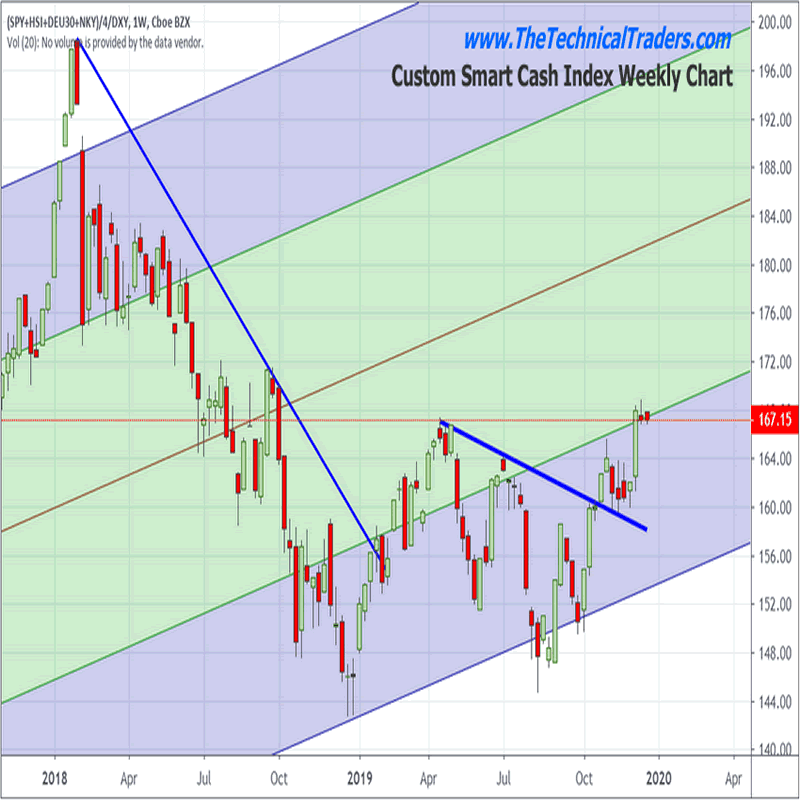
Our Custom Smart Cash Index chart highlights the upside breakout in October/November was validated by the upside price move in our Smart Cash index recently. The current price bars on our Smart Cash Index chart are much weaker overall and suggest the continued price advance over the past 2+ weeks maybe a tailwind trend and not supported by true price factors.
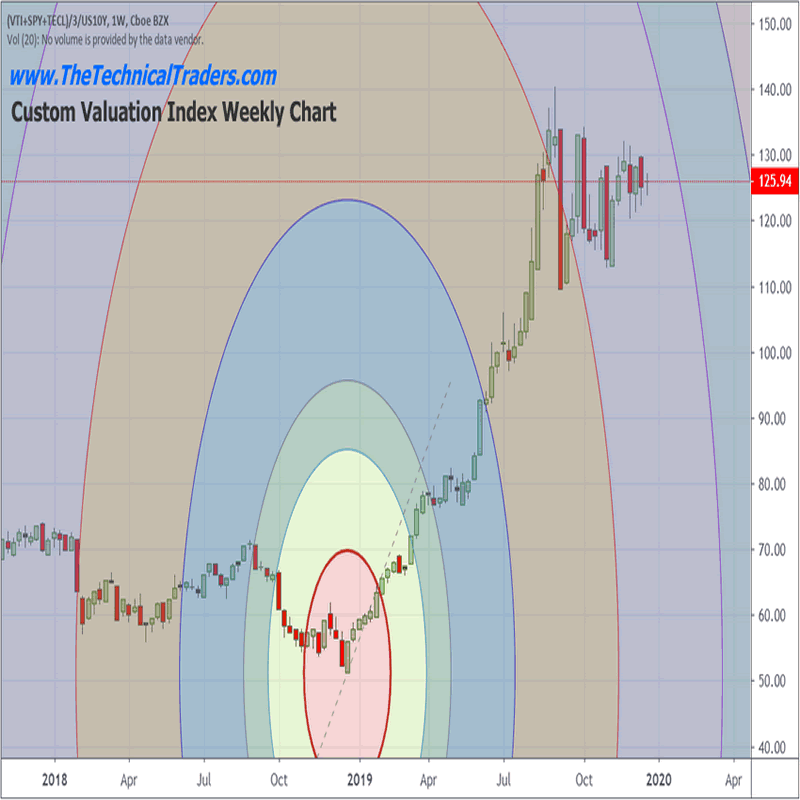
Our Custom Valuation Index Chart continues to show the US stock market is setting up in a Pennant/Flag formation from September 2019. This type of price pattern suggests that price has yet to really breakout of this consolidation pattern into a real trend. This one chart concerns us quite a bit because we believe early 2020 may result in a downside price rotation near the apex of this Flag formation prompting a massive spike in price volatility.
Ultimately, as you can see throughout most of 2019 when this Custom Valuation Index rallies, the US Stock Market prices rally as well. This is because the true valuation levels of stocks are increasing as investors expect increased earnings, profits and share prices. When this Custom Index consolidates or moves lower, it is a measure of investor sentiment related to future earnings/profit/valuation potential. Right now, it appears global traders have very little confidence in the future capabilities of increased valuations for the US Stock Market.
If this chart were to immediately begin a new rally, then our research team would suggest investors are turning more confident in future earnings/profit capabilities. If this chart were to collapse, then our research team would suggest the bottom is falling out of the current market price valuation levels – be cautious.
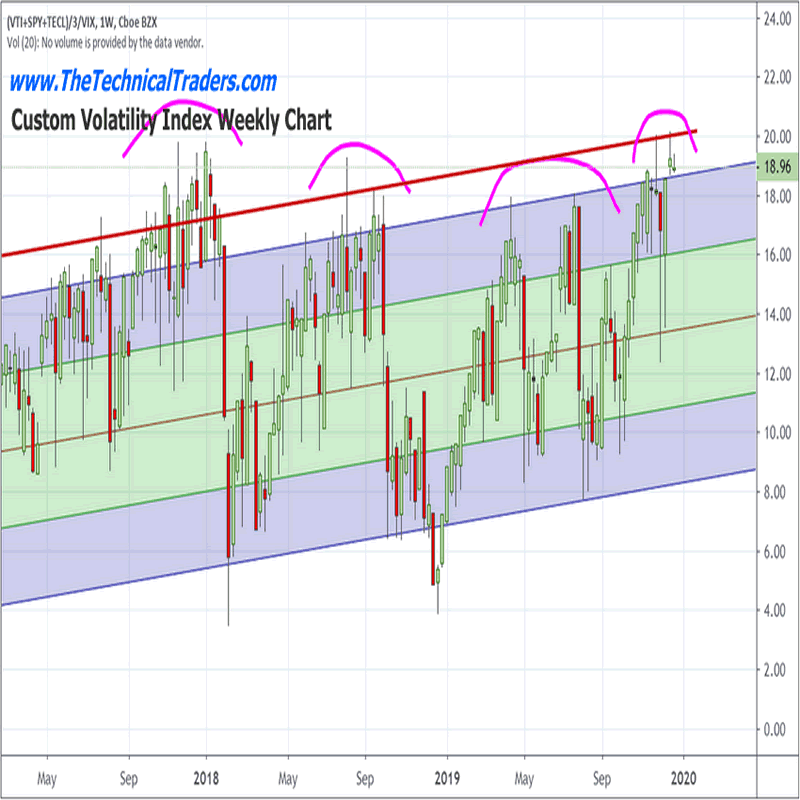
Lastly, our Custom Volatility Index chart suggests the end of year rally has stalled near the 20 level – which is typically an area where price tops or price rotation sets up. As you can see from our highlighted MAGENTA arcs on this chart, when this Custom Volatility Index rallies up toward these upper levels, price tends to stall before a moderate downside price rotation begins.
Sometimes, this setup prompts a major downside price move – such as the Jan/Feb 2018 price collapse and the Oct/Nov 2018 price collapse. Right now, this chart is suggesting that the end of year rally is weakening and could setup into another deeper downside price rotation.
What does this mean for early 2020? If the Smart Cash Index and the Valuation Index rally in early 2020, then we believe investors are turning decidedly bullish related to future earnings, profits and future valuation levels of the US stock market. If, as we expect, 2020 starts off with a moderate downside price rotation where the Smart Cash Index and the Valuation Index fall near the Apex of the Flag formation, then we could start 2020 with a decidedly weaker price move (possibly similar to what happened in January 2018).
The Custom Volatility Index will, most likely, attempt to fall to levels below 12~14 fairly early in 2020 which would accomplish two critical price components. First, it would establish a new price support level after the rally we’ve just experienced throughout the end of 2019. Second, it would complete a price rotation event that may allow for a new price trend to establish in early 2020. Both of these outcomes could prompt a potentially large spike in price volatility (VIX) as well as deliver a wake-up call for traders in early 2020.
Be prepared for a surprising spike in volatility in early 2020 with a moderately strong potential for an early 2020 downside price rotation which prompts a new price trend and possibly an early test of support (near 280 on the SPY chart). 2020 is going to be a fantastic year for skilled traders – get ready for some incredible price action.
As a technical analysis and trader since 1997 I have been through a few bull/bear market cycles, I have a good pulse on the market and timing key turning points for both short-term swing trading and long-term investment capital. The opportunities are massive/life-changing if handled properly.
I urge you visit my Wealth Building Newsletter and if you like what I offer, join me with the 1 or 2-year subscription to lock in the lowest rate possible and ride my coattails as I navigate these financial markets and build wealth while others lose nearly everything they own.
Chris Vermeulen
www.TheTechnicalTraders.com
Chris Vermeulen has been involved in the markets since 1997 and is the founder of Technical Traders Ltd. He is an internationally recognized technical analyst, trader, and is the author of the book: 7 Steps to Win With Logic
Through years of research, trading and helping individual traders around the world. He learned that many traders have great trading ideas, but they lack one thing, they struggle to execute trades in a systematic way for consistent results. Chris helps educate traders with a three-hour video course that can change your trading results for the better.
His mission is to help his clients boost their trading performance while reducing market exposure and portfolio volatility.
He is a regular speaker on HoweStreet.com, and the FinancialSurvivorNetwork radio shows. Chris was also featured on the cover of AmalgaTrader Magazine, and contributes articles to several leading financial hubs like MarketOracle.co.uk
Disclaimer: Nothing in this report should be construed as a solicitation to buy or sell any securities mentioned. Technical Traders Ltd., its owners and the author of this report are not registered broker-dealers or financial advisors. Before investing in any securities, you should consult with your financial advisor and a registered broker-dealer. Never make an investment based solely on what you read in an online or printed report, including this report, especially if the investment involves a small, thinly-traded company that isn’t well known. Technical Traders Ltd. and the author of this report has been paid by Cardiff Energy Corp. In addition, the author owns shares of Cardiff Energy Corp. and would also benefit from volume and price appreciation of its stock. The information provided here within should not be construed as a financial analysis but rather as an advertisement. The author’s views and opinions regarding the companies featured in reports are his own views and are based on information that he has researched independently and has received, which the author assumes to be reliable. Technical Traders Ltd. and the author of this report do not guarantee the accuracy, completeness, or usefulness of any content of this report, nor its fitness for any particular purpose. Lastly, the author does not guarantee that any of the companies mentioned in the reports will perform as expected, and any comparisons made to other companies may not be valid or come into effect.
Chris Vermeulen Archive |
© 2005-2022 http://www.MarketOracle.co.uk - The Market Oracle is a FREE Daily Financial Markets Analysis & Forecasting online publication.