


ERY Energy Bear Continues Basing Setup – Breakout Expected Near January 24th
Commodities / Energy Resources Jan 17, 2020 - 04:29 PM GMTBy: Chris_Vermeulen

After watching Crude Oil fall from the $65 ppb level to the $58 ppb level (-10.7%) over the past few weeks, we still believe the energy sector is setting up for another great trade for skilled investors/traders.
We are all keenly aware that Winter is still here and that heating oil demands may continue to push certain energy prices higher. Yet Winter is also a time when people don’t travel as much and, overall, energy prices tend to weaken throughout Winter.
Over the past 37 years, the historical monthly breakdown for Crude Oil is as follows: December: Generally lower by -$0.33 to -$0.86. Averages to the downside: -3.65 to +3.08 January: Generally lower by -$4.57 to -$6.72. Averages to the downside: -2.68 to +2.27 February: Generally higher by +$8.41 to +13.73. Averages to the upside +3.07 to -2.54 March: Generally higher by +7.33 to +$15.62. Averages to the upside by +2.84 to -2.14
Over the past 25 years, the historical monthly breakdown for Natural Gas is as follows: December: Generally lower by -$2.34 to -$5.26. Averages to the downside: -0.81 to +0.69 January: Generally lower by -$5.14 to -$7.97. Averages to the downside: -0.69 to +0.45 February: Generally lower by -$1.48 to -$3.62. Averages to the downside -0.50 to +0.49 March: Generally higher by +0.63 to +$1.88. Averages to the upside by +0.41 to -0.70
Over the past 35 years, the historical monthly breakdown for Heating Oil is as follows: December: Generally lower by -$0.16 to -$0.37. Averages to the downside: -0.14 to +0.09 January: Generally lower by -$0.52 to -$0.96. Averages to the downside: -0.09 to +0.10 February: Generally higher by +$0.48 to +$1.06. Averages to the upside +0.11 to -0.08 March: Generally higher by +0.03 to +$0.11. Averages to the upside by +0.09 to -0.10
This data suggests an extended Winter in the US may prompt further contraction in certain segments of the energy sector that may prompt an exaggerated downside price move in Crude Oil and Natural Gas. Heating Oil may rise a bit if the cold weather continues well past March/April 2019.
Conversely, if an early spring sets up in the US, then Crude Oil may begin to base a bit as people begin to traveling more, but Heating Oil and Natural Gas may decline as cold weather demands abate.
Heating Oil has almost mirrored Crude Oil in price action recently. Our modeling systems are suggesting that Crude Oil may attempt to move below $40 ppb. This move would be a result of a number of factors – mostly slowing global demand and a shift to electric vehicles. We authored this research post early in January 2020 – please review it.
January 8, 2020: IS THE ENERGY SECTOR SETTING UP ANOTHER GREAT ENTRY?
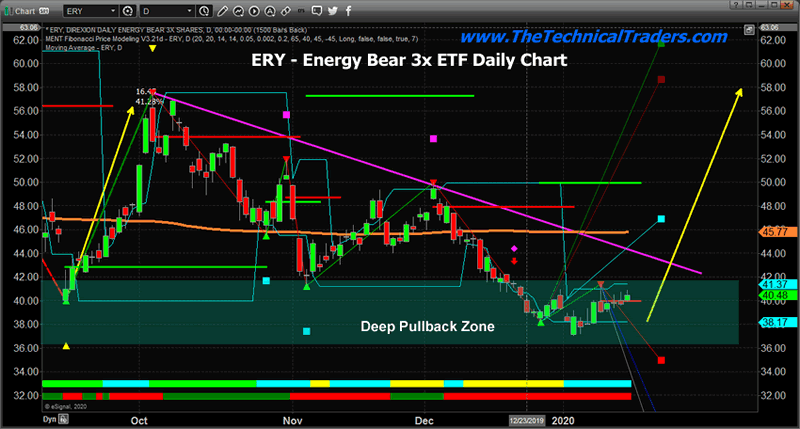
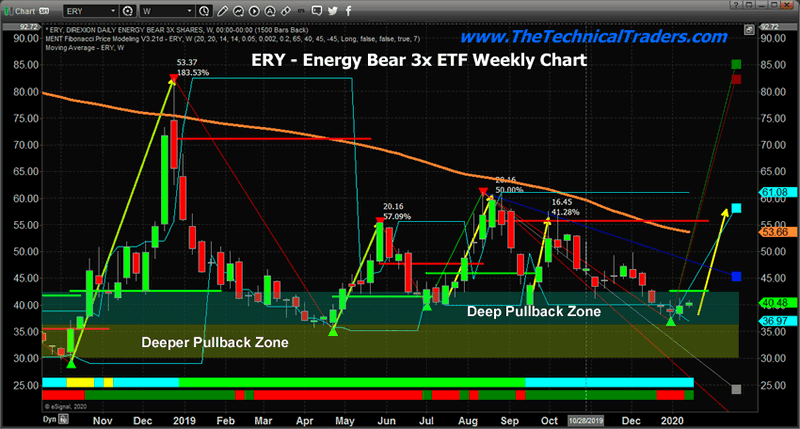
We believe any price level below $40 in ERY is setting up for a very strong basing level going forward. We have identified two “pullback zones”. The first is what we call the “Deep Pullback Zone”. The second is what we call the “Deeper Pullback Zone”. Any upside price move from below $40 to recent upside target levels (above $50) would represent a 25%+ price rotation.
Historically, February is a very strong month for ERY. The data going back over the past 12 years suggests February produces substantially higher upside price gains (+1899.30 to -394.28) – translating into a 4.8:1 upside price ratio over 12 years. Both January and March reflect overall price weakness in ERY over the past 12 years. Thus, the real opportunity is the setup of the “February price advance”.
We believe any opportunity to take advantage of this historical technical price pattern is advantageous for skilled traders/investors.
This is a pure technical pattern based on price bar data mining. This is something you may not have ever considered unless you had the tools to search for historical price anomalies and rotation patterns. We have created a suite of tools and price modeling systems we use to help our members find incredible opportunities – this being one of them.
Get ready, February will likely prompt a very nice rally in ERY if historical price triggers confirm future price activity. The price pattern in February suggests a large upside price move is likely in ERY and we believe these low price basing patterns are an excellent opportunity for skilled traders.
Join my Wealth Building Newsletter if you like what you read here and ride my coattails as I navigate these financial markets and build wealth while others lose nearly everything they own.
Chris Vermeulen
www.TheTechnicalTraders.com
Chris Vermeulen has been involved in the markets since 1997 and is the founder of Technical Traders Ltd. He is an internationally recognized technical analyst, trader, and is the author of the book: 7 Steps to Win With Logic
Through years of research, trading and helping individual traders around the world. He learned that many traders have great trading ideas, but they lack one thing, they struggle to execute trades in a systematic way for consistent results. Chris helps educate traders with a three-hour video course that can change your trading results for the better.
His mission is to help his clients boost their trading performance while reducing market exposure and portfolio volatility.
He is a regular speaker on HoweStreet.com, and the FinancialSurvivorNetwork radio shows. Chris was also featured on the cover of AmalgaTrader Magazine, and contributes articles to several leading financial hubs like MarketOracle.co.uk
Disclaimer: Nothing in this report should be construed as a solicitation to buy or sell any securities mentioned. Technical Traders Ltd., its owners and the author of this report are not registered broker-dealers or financial advisors. Before investing in any securities, you should consult with your financial advisor and a registered broker-dealer. Never make an investment based solely on what you read in an online or printed report, including this report, especially if the investment involves a small, thinly-traded company that isn’t well known. Technical Traders Ltd. and the author of this report has been paid by Cardiff Energy Corp. In addition, the author owns shares of Cardiff Energy Corp. and would also benefit from volume and price appreciation of its stock. The information provided here within should not be construed as a financial analysis but rather as an advertisement. The author’s views and opinions regarding the companies featured in reports are his own views and are based on information that he has researched independently and has received, which the author assumes to be reliable. Technical Traders Ltd. and the author of this report do not guarantee the accuracy, completeness, or usefulness of any content of this report, nor its fitness for any particular purpose. Lastly, the author does not guarantee that any of the companies mentioned in the reports will perform as expected, and any comparisons made to other companies may not be valid or come into effect.
Chris Vermeulen Archive |
© 2005-2022 http://www.MarketOracle.co.uk - The Market Oracle is a FREE Daily Financial Markets Analysis & Forecasting online publication.