


Stock Market Sector Rotation Should Peak Within 60+ Days – Part II
Stock-Markets / Stock Markets 2020 Feb 11, 2020 - 03:19 PM GMTBy: Chris_Vermeulen

The first part of this article highlighted what we believe is the start of a broad market sector rotation setup in the US and global markets. This second part will highlight what we believe are excellent examples of sector trade setups for our friends and followers.
As China continues to pour capital into their markets to stabilize the outflow and fall of asset prices, a number of interesting components of broader sector rotation are setting up. First, the US stock market has rolled lower in what we are calling a “first-tier” of the “waterfall event”.
Additionally, Mid-Caps, Transportation, Energy, and Financials have all started to roll-over of already begun to rotate lower. We believe the contraction in economic activity and global market engagement as a result of the Wuhan virus will result in a much bigger and broader downside price move than many are expecting in the coming weeks.
The death toll for the Coronavirus outbreak reached 910, surpassing the number that died in the 2003 SARS episode. This is causing huge issues with global supply chains and shipping companies as I talked about last week in my HoweStreet Interview.
We believe traders need to be aware of the continued capital shift that has been taking place over the past 4+ years. As foreign markets struggle and the US Dollar continues to strengthen, capital has been moving into the US stock market as a protective measure. We believe this will continue throughout the virus event, yet we believe the US stock market will contract, move lower, as a result of this virus event as well.
Many US companies are still exposed to foreign markets through overseas engagement and retail locations, Automakers, consumer products, manufacturing, heavy equipment and dozens of other sectors derive 5% to 25%+ of their revenues from China and other overseas markets. MacDonalds, Starbucks, Caterpillar and dozens of other US companies have broad exposure in China and Asia. We believe this virus event could last well into July and possibly much longer. Because of this, we believe a broader market sector rotation will take place and that volatility will continue to increase over the next 6 to 12+ months.
Here are the three sectors we believe have a strong potential for setting up a fantastic trade. Follow our research to learn more about what we do and how we can help you find incredible trade setups.
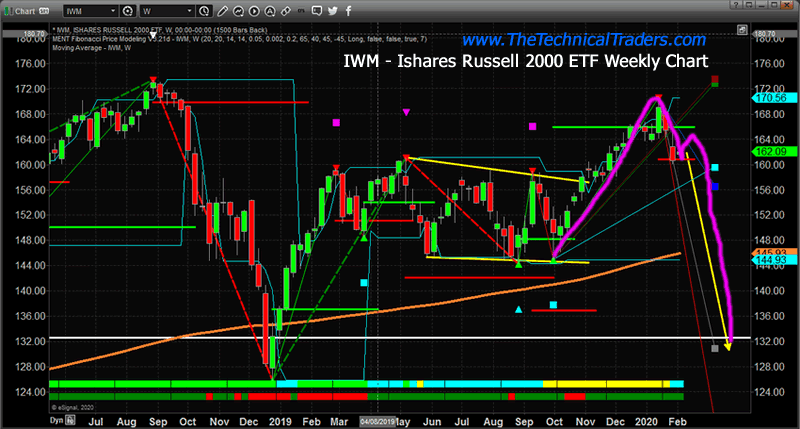
Russell 2000 (IWM) – Weekly Chart
The Russell 2000 (IWM) has already started to move a bit lower over the last few weeks. Even though the US stock market was plowing higher throughout most of December and January, the Russell 2000 is actually showing signs of a rounded top formation with a very clear downside “first leg” (waterfall) type of price decline. We believe broader market contraction and sector rotation could push IWM below $144 in an attempt to target historical support near $126.
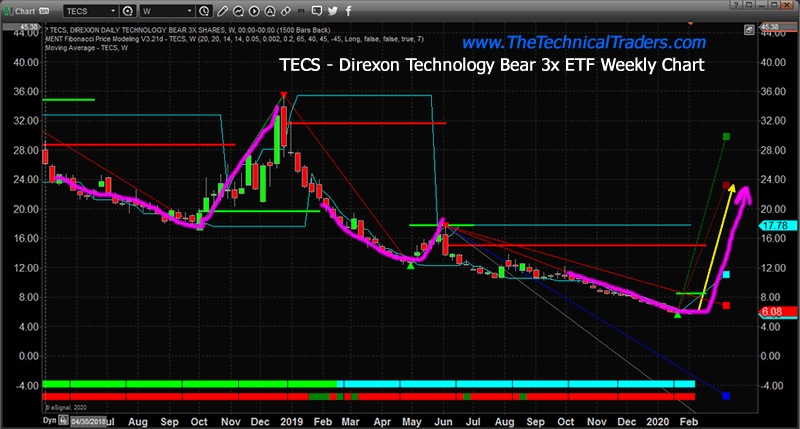
TECS Technology Sector ETF – Weekly Chart
The Technology sector may see a broader market decline over the next 30 to 60 days that could push TECS from recent lows, below $6, to levels above $12 to $16 on a reactionary move in this 3x ETF. TECS has experienced very low volatility over the past 3+ months while the US stock market has continued to rally in Q3 and Q4. Any breakdown in the global technology sector could push TECS well above recent peak levels near $18.
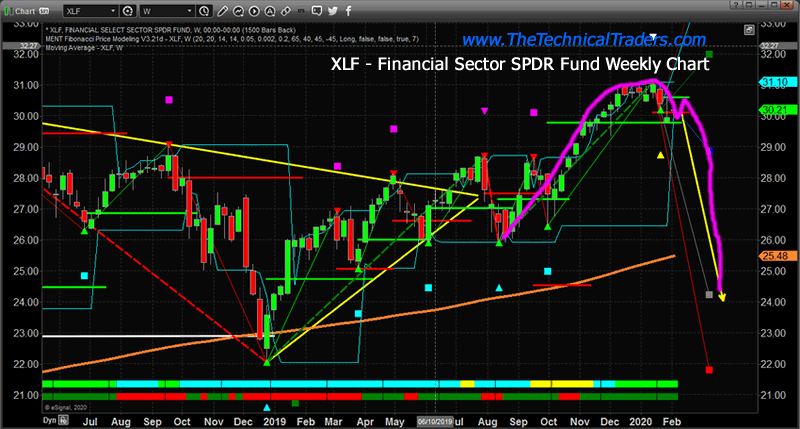
XLF Financial Sector ETF – Weekly Chart
The Financial Sector is very likely to experience a 3% to 10% decrease in consumer activity related to the lack of travel, outside entertainment, shopping and food services activities and could see extended risk to loans, debts, and other services as a result of a global economic market contraction. We believe a downside risk exists in XLF where the price will likely break below $30 and target the $25 to $26 level over the next 30 to 60+ days. Ultimately, XLF must hold above the December 2018 lows near $22 if the current downside rotation ends within recent price ranges. A move below $22 would indicate we have entered a new stage of a Bear trend.
The reality of the situation for most of us is that we are not at immediate risk of catching anything except a common cold or flu. As skilled traders, we must identify an opportunity where it presents itself and we must attempt to learn to capitalize on that opportunity. We believe these sectors, and many others, are about to present very real trading opportunities for skilled traders.
The virus is expected to double in scope every 6.5 days based on modeling data. Obviously China and Asia are the biggest risks right now. Our biggest concern is that the virus spreads into India and Africa. We believe a spread into these regions could add hundreds of thousands or millions of infected people to the lists. At this point, it is far too early to tell how extended this virus event will become – yet we feel we are just starting this rotation and the true scope of it won’t be known for many weeks or months.
Join us in our quest to create incredible profits from these bigger trends today. As a technical analyst and trader since 1997 I have been through a few bull/bear market cycles, I have a good pulse on the market and timing key turning points for both short-term swing trading and long-term investment capital. The opportunities are massive/life-changing if handled properly.
Join my Swing Trading ETF Wealth Building Newsletter if you like what you read here and ride my coattails as I navigate these financial markets and build wealth while others lose nearly everything they own.
Chris Vermeulen
www.TheTechnicalTraders.com
Chris Vermeulen has been involved in the markets since 1997 and is the founder of Technical Traders Ltd. He is an internationally recognized technical analyst, trader, and is the author of the book: 7 Steps to Win With Logic
Through years of research, trading and helping individual traders around the world. He learned that many traders have great trading ideas, but they lack one thing, they struggle to execute trades in a systematic way for consistent results. Chris helps educate traders with a three-hour video course that can change your trading results for the better.
His mission is to help his clients boost their trading performance while reducing market exposure and portfolio volatility.
He is a regular speaker on HoweStreet.com, and the FinancialSurvivorNetwork radio shows. Chris was also featured on the cover of AmalgaTrader Magazine, and contributes articles to several leading financial hubs like MarketOracle.co.uk
Disclaimer: Nothing in this report should be construed as a solicitation to buy or sell any securities mentioned. Technical Traders Ltd., its owners and the author of this report are not registered broker-dealers or financial advisors. Before investing in any securities, you should consult with your financial advisor and a registered broker-dealer. Never make an investment based solely on what you read in an online or printed report, including this report, especially if the investment involves a small, thinly-traded company that isn’t well known. Technical Traders Ltd. and the author of this report has been paid by Cardiff Energy Corp. In addition, the author owns shares of Cardiff Energy Corp. and would also benefit from volume and price appreciation of its stock. The information provided here within should not be construed as a financial analysis but rather as an advertisement. The author’s views and opinions regarding the companies featured in reports are his own views and are based on information that he has researched independently and has received, which the author assumes to be reliable. Technical Traders Ltd. and the author of this report do not guarantee the accuracy, completeness, or usefulness of any content of this report, nor its fitness for any particular purpose. Lastly, the author does not guarantee that any of the companies mentioned in the reports will perform as expected, and any comparisons made to other companies may not be valid or come into effect.
Chris Vermeulen Archive |
© 2005-2022 http://www.MarketOracle.co.uk - The Market Oracle is a FREE Daily Financial Markets Analysis & Forecasting online publication.