Crude Oil Price Action – Like a Coiled Spring Already?
Commodities / Crude Oil Feb 13, 2020 - 09:41 AM GMTBy: Nadia_Simmons
Trading slightly above the $50 mark, crude oil hasn’t made a decisive move either way so far. Yesterday’s bullish session has brought us new clues. Let’s dive and examine the strength of the evolving oil move higher.
We’ll start by taking a closer look at the daily chart (charts courtesy of http://stockcharts.com).

Yesterday, we wrote the following:
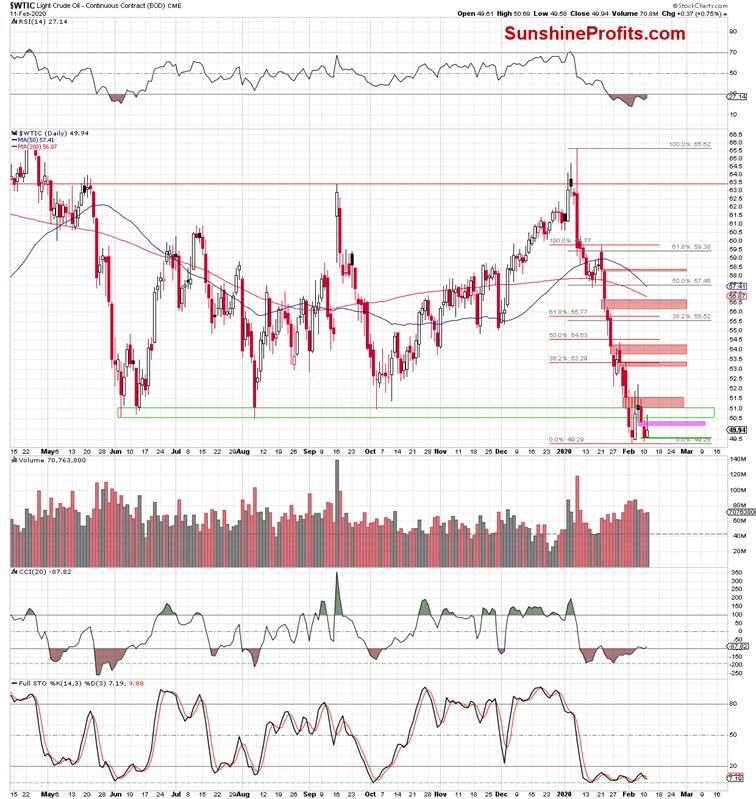
(…) the pink gap created yesterday remains in the cards, blocking the way to the north. Additionally, when we focus on the daily chart, we can see that similar price action took place on January 29. Back then, the futures (and also crude oil later in the day) also opened with a bullish gap, but the bearish gap created two days earlier stopped the bulls, triggering a decline in the following hours.
Will we see something similar this time as well?
In our opinion, as long as the pink gap remains open, the bulls and crude oil futures (and crude oil itself) are threatened by further declines. (…)
The situation has indeed developed in tune with the above, and crude oil pulled back after unsuccessfully attempting to close the pink gap, just like it did on January 29.
The bulls showed more strength this time, however. The green gap they created at the beginning of the day, remained out of the reach of the bears. It still serves as the nearest very short-term support.
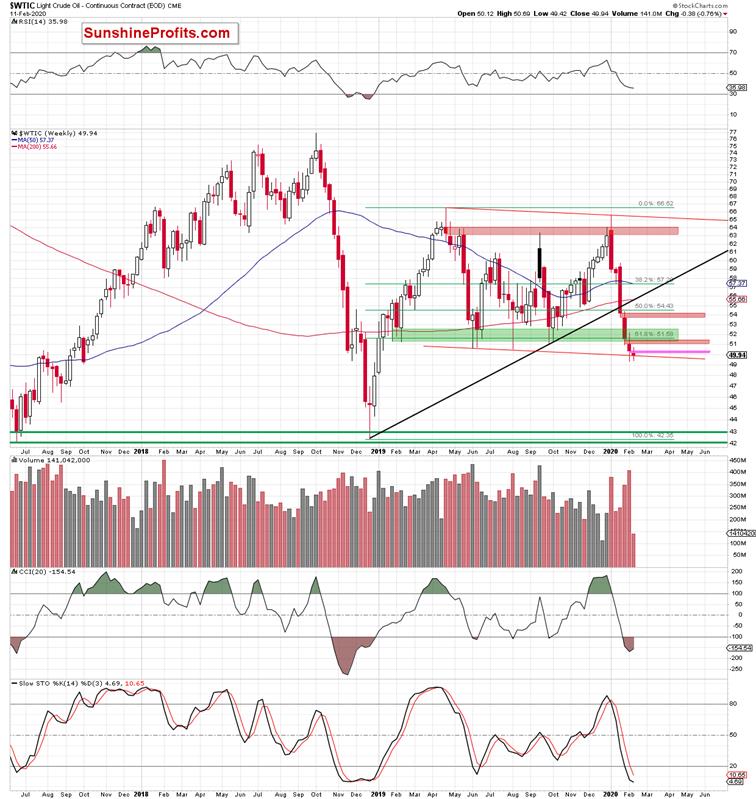
Additionally, yesterday’s price action took the commodity back above the previously broken lower border of the declining red trend channel marked on the weekly chart below.

Let’s check the reflection of these developments in today's premarket action.

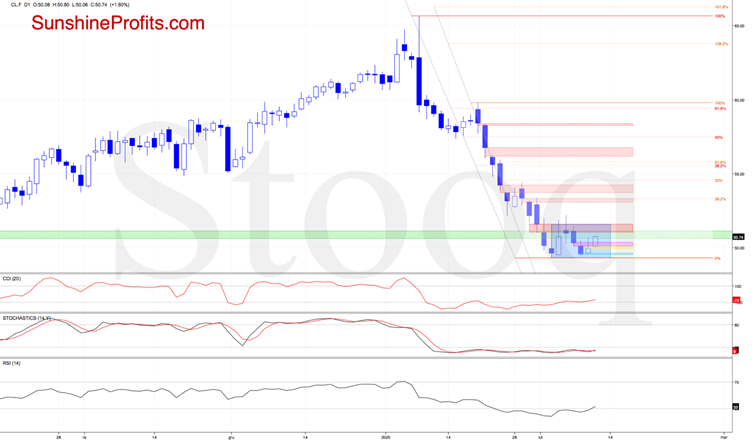
Crude oil futures opened today with the yellow bullish gap, which triggered further improvement in the following hours.
This upswing is attempting to close the pink gap created on Monday. That’s encouraging for the bulls, and suggests that we’ll likely see the red gap created on February 3, 2020 tested later in the day.
This resistance was strong enough to stop the buyers five times in a row, which increases the probability that we could see another reversal and decline from here in the very near future. That could happen even later in the day after the EIA report. It’s worth pointing out that the American Petroleum Institute showed yesterday that US crude oil inventories rose sharply last week (by 6 million barrels for the week ended Feb. 7). That doesn’t bode well for higher oil prices – especially if today’s EIA report confirms higher than expected increase in crude oil stockpiles.
This scenario is also reinforced by the green zone based on the previous lows and the upper border of the blue consolidation, which both work to reinforce this resistance zone. Additionally, another move to the downside and a fresh 2020 low would be in line with the Elliott Wave Theory.
Nevertheless, nothing in the market is 100% certain that is why we must also take into account the growth scenario, especially since that the price of black gold is in consolidation. Therefore, should the bulls manage to close the day above the above-mentioned resistances, we’ll consider opening long positions.
Summing up, while oil bulls couldn’t close the nearest bearish gap yesterday, and formidable resistances remain, we might see a break either way shortly. As for the bearish break, the fundamental expectations of high EIA stockpiles report and Elliott wave analysis support that. As for the bullish break, the very short-term gap analysis speaks in favor. It remains to be seen though whether the bulls manage to close today above the key resistances. If they do, we’ll consider opening long positions.
If you enjoyed the above analysis and would like to receive daily premium follow-ups, we encourage you to sign up for our Oil Trading Alerts to also benefit from the trading action we describe – the moment it happens. The full analysis includes more details about our current positions and levels to watch before deciding to open any new ones or where to close existing ones.
Check more of our free articles on our website – just drop by and have a look. We encourage you to sign up for our daily newsletter, too - it's free and if you don't like it, you can unsubscribe with just 2 clicks. If you sign up today, you'll also get 7 days of free access to our premium daily Stock Trading Alerts as well as our other Alerts. Sign up for the free newsletter today!
Nadia Simmons
Forex & Oil Trading Strategist
Przemyslaw Radomski
Founder, Editor-in-chief
Sunshine Profits: Gold & Silver, Forex, Bitcoin, Crude Oil & Stocks
Stay updated: sign up for our free mailing list today
* * * * *
Disclaimer
All essays, research and information found above represent analyses and opinions of Nadia Simmons and Sunshine Profits' associates only. As such, it may prove wrong and be a subject to change without notice. Opinions and analyses were based on data available to authors of respective essays at the time of writing. Although the information provided above is based on careful research and sources that are believed to be accurate, Nadia Simmons and his associates do not guarantee the accuracy or thoroughness of the data or information reported. The opinions published above are neither an offer nor a recommendation to purchase or sell any securities. Nadia Simmons is not a Registered Securities Advisor. By reading Nadia Simmons’ reports you fully agree that he will not be held responsible or liable for any decisions you make regarding any information provided in these reports. Investing, trading and speculation in any financial markets may involve high risk of loss. Nadia Simmons, Sunshine Profits' employees and affiliates as well as members of their families may have a short or long position in any securities, including those mentioned in any of the reports or essays, and may make additional purchases and/or sales of those securities without notice.
© 2005-2022 http://www.MarketOracle.co.uk - The Market Oracle is a FREE Daily Financial Markets Analysis & Forecasting online publication.


