


Stock Market Crash- Where's the Bottom?
Stock-Markets / Financial Crash Oct 08, 2008 - 02:30 AM GMTBy: Weekly_Wizards

 Our Wizards Harry Boxer, Mike Paulenoff and Jack Steiman weigh in this week on the direction of the markets.
According to Boxer, author of The Technical Trader : We are in a critical mode in the market. From mid-August to early October, literally only 6 weeks, that's all it's taken for the NDX to go from 1973 down to 1329, nearly 650 points, or about a third of its value, culminating with a spike down into what looks like perhaps very close to an important major low. We'll see if that occurs. There are very difficult fundamentals right now in the economy and we're not getting any good news. But we are stretched to the downside way more than we'd expect, and the oscillators, the VIX/VIXN and many other technical indicators I follow are at multiyear, if not historical, levels.
The technicals on Tuesday were climactic. Advance-declines were decidedly negative by about 28 to 4 on New York and 24 to 5 1/2 on Nasdaq. Up/down volume was about 18 to 1 negative on New York, with just 73 million in advancing volume and 1.65 billion to the downside. Nasdaq had some VERY negative numbers to the downside, nearly 2 3/4 billion shares traded to the downside and 88 1/2 million to the upside, a ratio of more than 30 to 1 negative. That's as climactic as it gets. Be on the alert for a potential, important bottom in the next few days.
Sign up for a free 15-day trial to Harry's Real-time Technical Trading Diary. 80% Winning Trades! +2.9% Average Returns per Day Trade! Includes Harry's Weekly List of Top "Boxer Shorts"!
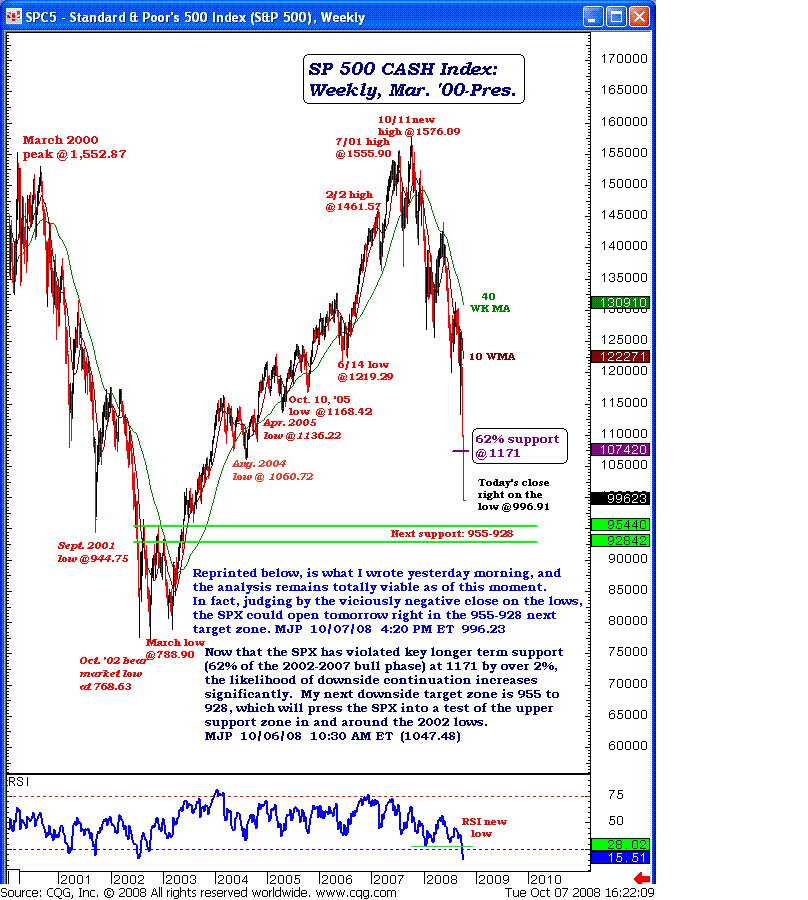
According to Mike Paulenoff, author of MPTrader.com :
Another "normal" day, down 508 Dow points! Today's last hour selling pressure after yesterday's late-session upside reversal had the feel of a very demoralizing, and capitulatory price move. I would not be surprised to see acute weakness into tomorrow morning's U.S. session. If such a scenario unfolds, it is anyone's guess how low the pressure drives the cash SPX. With that in mind, I leave you this evening with the BIG picture view of the cash SPX...which identifies the next target zone for the October 2007-October 2008 bear market.
As I noted to our subscribers on Monday morning, and which remains viable here at Tuesday's close: "Now that the SPX has violated key longer-term support (62% of the 2002-2007 bull phase) at 1171 by over 2%, the likelihood of significant downside continuation increases significantly." My next downside target zone is 955 to 928, where it could open tomorrow, which will press the SPX into a test of the upper support zone in and around the 2002 lows.
Sign up for a free 15-day trial to Mike's ETF Trading Diary 18 Winning Trades out of 19 in September (+36.7% Total Return).
According to Jack Steiman, author of SwingTradeOnline.com :
The market followed through to the down side even though all you heard on Cnbc yesterday after the market closed was the bottom is in. Why the follow through down when many "experts" said the bottom was in? Because we did not get a single technical buy signal from the reversal that took place. I went over it last night in the newsletter but let's talk about it again. Did we get hollow candles anywhere on the major indexes?
No. We closed lower than where we opened even though we were way off the lows. Still had on balance selling from the open. Did we have the proper advance decline line at the end of the day? Never worse thus no. Twenty losers to every one winner on the Nyse. Bottom? With numbers like that? Shame on these shills telling folks to get back in there today. The market was up 200 early today and these poor folks were running in and now the Dow is down 700 points on them. We didn't have any, not one buy signal from yesterday's reversal yet you'd think we had just seen the greatest turn around of all time.
Everyone is looking for the bottom. STOP IT!!! The bottom could be tomorrow or it could be six months from now. We don't know. There are NO positive divergences on any of the critical longer term time frame charts on any of the major indexes. Not on the daily's, weekly's or monthly's. Not anywhere. All of them look bad and all of them have Macd's that have further to fall should the bears garner up enough energy to get that job done.
The longer term charts are not oversold to the point where it can't go lower. Doesn't mean they will go lower but they have the technical room to do so. So yes, there were capitulatory events yesterday you could talk about but without the proper price behavior and technical's to confirm that price behavior, you just have to stop looking for the bottom. When it happens we would like to think we'll see it and go from there. The market will make itself clear about a bottom. It's best if it happens from a gap down and not a move up. That's when you get a chance to print those necessary hollow or even clear black candles. That's when the market embarks on that massive pent up rally that'll make folks feel good and will be sustainable for some weeks if not months.
Sign up for a free 30-day trial to Jack Steiman's SwingTradeOnline. .
http://www.advicetrade.com/Wizards
© 2002-2008 MPTrader.com, Weekly Wizards an AdviceTrade publication. All rights reserved. Any publication, distribution, retransmission or reproduction of information or data contained on this Web site without written consent from MPTrader is prohibited. See our disclaimer.
Weekly Wizards Archive |
© 2005-2022 http://www.MarketOracle.co.uk - The Market Oracle is a FREE Daily Financial Markets Analysis & Forecasting online publication.