


Coronavirus Impact on Global Economic GDP Numbers
Economics / Global Economy Mar 19, 2020 - 11:44 AM GMTBy: Chris_Vermeulen

Continuing our earlier multi-part research post related to our extensive number crunching and predictive modeling systems expectations going forward many years, (Part I) this second part will highlight some existing data points and start to discuss the concepts of what the Covid-19 virus event may do to the immediate global economy. Remember, in the first part of this article, we shared research related to the US Fed Funds Rate (FFR) and how the Covid-19 virus event may create an environment of economic malaise over the next 12 to 24+ months as well as potentially disrupt the population and deficits over a 5+ year span.
This type of event is very similar to war (think WWII) in the sense that consumer spending changes, population growth, and levels change, GDP changes and deficits change for all involved. Our researchers modeled the GDP levels from 2017 will now with the intent of attempting to identify probable outcomes of GDP output throughout the world over the next 5+ years. Throughout these types of events, a massive capital shift takes place where consumers within areas impacted by war shift their spending and purchasing habits to address the immediate real needs of their attempted survival. Speculation vanishes. People only spend on things they are confident they can afford to risk their money on. Anyone who is able to take advantage of the displaced or disparaged has a real opportunity to create some real gains if they don’t become the next displaced or disparaged individual.
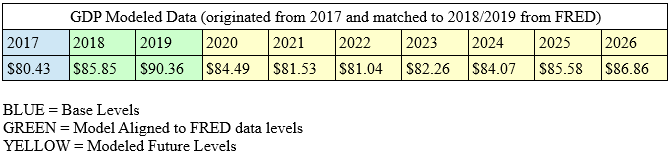
Here is some data we used to model what we believe will happen over the next 2 to 5+ years as a result of the Covid-19 virus event. We are using this global data as a basis for our modeling going forward and attempting to align 2018 and 2019 data with that reported by the St. Louis Federal Reserve data. Our objective is to attempt to identify the scope and extend of any potential change in economic cycles going forward and to prepare our friends and followers of what to expect.
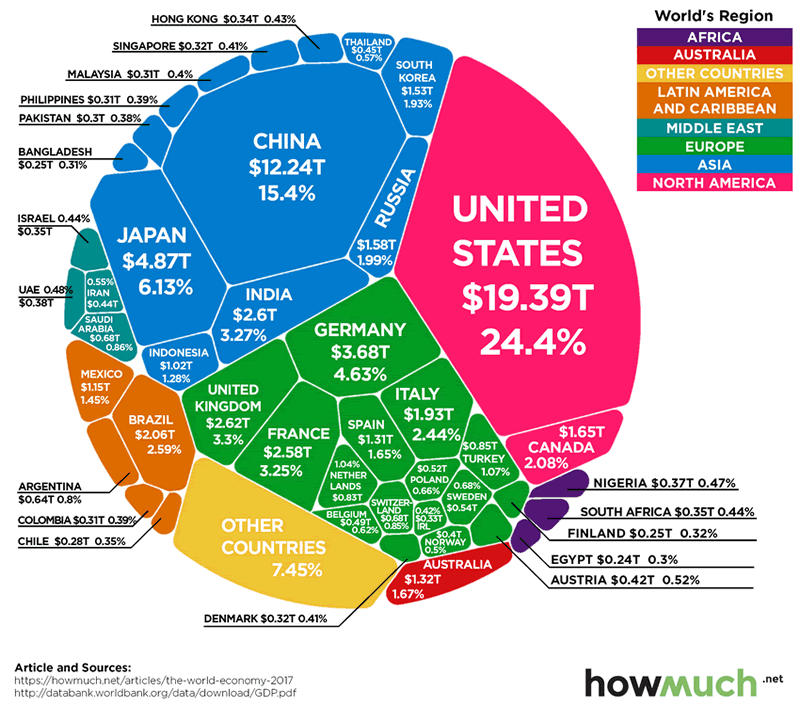
This data illustrates the scale and scope of the total global GDP output of all the nations on the planet for 2017. It is important to understand that China and the United States are the two biggest GDP producers of all nations. Between the US and China, both nations produce roughly 40% of the world’s total GDP annually. When you consider all nations producing more than $1.5T in annual GDP on this graphic, these 12+ nations (including OTHERS) produce nearly 78% of the world’s total GDP annually.
The nations that make up this list of top GDP producing nations are:
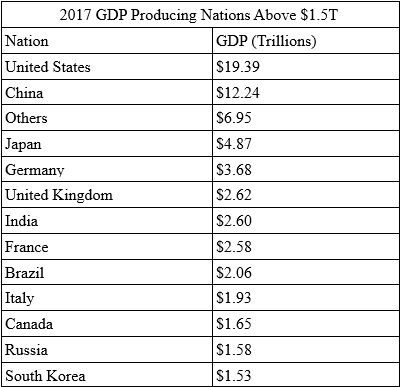
These nations (and the group of nations listed as OTHERS) total almost 80% of total annual GDP across the entire planet. Keeping in mind that we are attempting to model the Covid-19 virus event, which nations are likely to be the hardest hit on this list? Obviously China, Japan, Germany, Italy, South Korea, and the United States are all prime targets of the Covid-19 virus event. Brazil, Canada, France, India, and Others are secondary targets for GDP disruption. Yet, their proximity to the price candidates makes them fairly easy targets for future GDP disruption related to the Covid-19 virus.
The point we are trying to make by illustrating this is that 80% of the world’s total GDP is at risk over the next 24+ months related to shifting consumer spending, central bank activities, asset valuation levels and much more. We’re not talking about 4% or 5% of the world – we’re clearly showing you that 80% of the world’s total economic output is within the cross-hairs of this virus event.
Be sure to opt-in to our free market trend signals before closing this page, so you don’t miss our next special report!
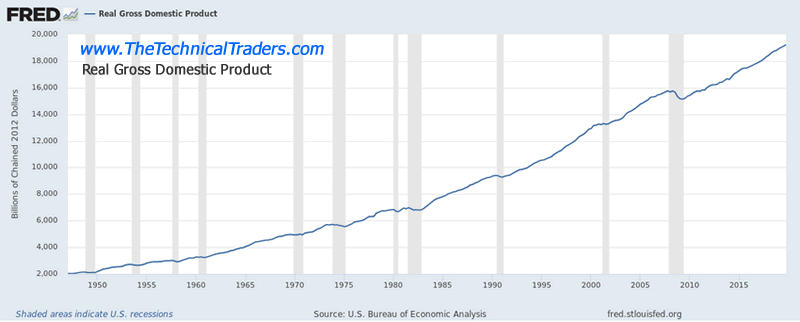
Our modeling suggests the 2017 GDP levels presented by the image (above) and the subsequent yearly REAL GDP levels presented by the St. Louis Federal Reserve deliver this data as a basis for our modeling system.
Our attempted modeling of the Covid-19 virus event across global economies is based, in part, on what happened in the 2008-09 Credit Crisis event. Throughout that span of time (2008 to 2009), US GDP fell -3.36% over 12 to 16 months. The difference between this Credit Crisis event and the Covid-19 event is that the Covid-19 event appears to be disrupting a broader segment of economic sectors across dozens of nations/cities all at once. Whereas the Credit Crisis event resulted in somewhat isolated asset and economic contractions related to banking, insurance, credit, and assets – the Covid-19 virus event appears to be much broader in scope and consequences. Our researchers believe the Covid-19 virus event will reach nearly every segment of the global economy in some way or form – causing some type of economic disruption either in supply, demand or overall consumer activity related to the sector/economic component. Therefore, we believe the scope of the contagion event related to Covid-19 will be, at a minimum, 2x to 3x the scale and scope of the Credit Crisis.
We’ve come to the conclusion that the disruption to earnings, revenues, expenses and other economic factors across a broad spectrum of global economic outputs may look something like this.

We believe Q1 and Q2 of this year will be a disaster for almost all nations. We believe there is a chance Q3 and Q4 2020 may see a moderately strong recovery (or the start of a recovery). We believe winter 2020 and into 2021 may bring further influenza type illness and may begin the process anew. Or, we believe the recovery process may be somewhat stalled in 2021 as we believe the fallout from the previous year may still be taking place across multiple asset classes and corporate level and banking/insurance level industries. We believe that by mid-2022 and early 2023, the global economy will begin to find a solid foundation for future economic growth and that global GDP may begin to move higher overall.
We are basing our modeling process on the information we have gained from our experience in the markets and from living through the 2008-09 Credit Crisis event. Far too many people fail to understand the contagion event process that takes place when consumers abandon traditional spending patterns as income levels become more “at-risk”. As we’ve suggested many times in previous articles, consumer spending and the “flock mentality” is not something to underestimate. Current GDP levels are calculated mostly by consumer spending activity. Think about what that means going forward.
Here are some St. Louis Federal Reserve data charts that we used in attempting to model these results.
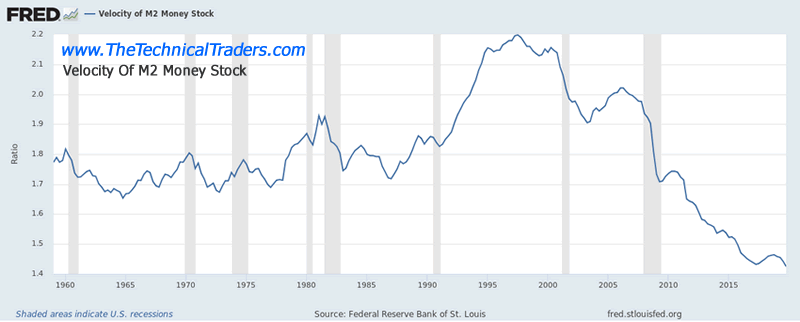
A potential further decrease in M2 (velocity of money) throughout this Covid-19 virus event is very likely. This is one of the primary reasons we believe this event may last more than 24 months in total span. We believe the continued decline of the M2 velocity level is a very strong indication that historical levels of economic activity (1965 through 1995) simply are not present in today’s global economic world. This complicates how money is used within the global market – it is being engaged as active money transactions by a -30% ration than 1995 levels. If M2 continues to decline, we believe the consequence of this move will relate to an even slower recovery from the Covid-19 virus event.
In the next part of this article, we’ll explore the real data points and outlier expectations of the 2020 Covid-19 virus event.
As a technical analysis and trader since 1997, I have been through a few bull/bear market cycles. I believe I have a good pulse on the market and timing key turning points for short-term swing traders.
Visit my ETF Wealth Building Newsletter and if you like what I offer, and ride my coattails as I navigate these financial markets and build wealth while others lose nearly everything they own during the next financial crisis.
Chris Vermeulen
www.TheTechnicalTraders.com
Chris Vermeulen has been involved in the markets since 1997 and is the founder of Technical Traders Ltd. He is an internationally recognized technical analyst, trader, and is the author of the book: 7 Steps to Win With Logic
Through years of research, trading and helping individual traders around the world. He learned that many traders have great trading ideas, but they lack one thing, they struggle to execute trades in a systematic way for consistent results. Chris helps educate traders with a three-hour video course that can change your trading results for the better.
His mission is to help his clients boost their trading performance while reducing market exposure and portfolio volatility.
He is a regular speaker on HoweStreet.com, and the FinancialSurvivorNetwork radio shows. Chris was also featured on the cover of AmalgaTrader Magazine, and contributes articles to several leading financial hubs like MarketOracle.co.uk
Disclaimer: Nothing in this report should be construed as a solicitation to buy or sell any securities mentioned. Technical Traders Ltd., its owners and the author of this report are not registered broker-dealers or financial advisors. Before investing in any securities, you should consult with your financial advisor and a registered broker-dealer. Never make an investment based solely on what you read in an online or printed report, including this report, especially if the investment involves a small, thinly-traded company that isn’t well known. Technical Traders Ltd. and the author of this report has been paid by Cardiff Energy Corp. In addition, the author owns shares of Cardiff Energy Corp. and would also benefit from volume and price appreciation of its stock. The information provided here within should not be construed as a financial analysis but rather as an advertisement. The author’s views and opinions regarding the companies featured in reports are his own views and are based on information that he has researched independently and has received, which the author assumes to be reliable. Technical Traders Ltd. and the author of this report do not guarantee the accuracy, completeness, or usefulness of any content of this report, nor its fitness for any particular purpose. Lastly, the author does not guarantee that any of the companies mentioned in the reports will perform as expected, and any comparisons made to other companies may not be valid or come into effect.
Chris Vermeulen Archive |
© 2005-2022 http://www.MarketOracle.co.uk - The Market Oracle is a FREE Daily Financial Markets Analysis & Forecasting online publication.