


Concerned About The US Real Estate Market? Us Too!
Housing-Market / US Housing Mar 23, 2020 - 06:23 PM GMTBy: Chris_Vermeulen

The current global Covid-19 virus event has upended everyone’s forward expectations related to the US and global economy. Recently, President Trump has announced a 12-month reprieve for homeowners who find themselves without income, or a job, because of the US National Emergency related to the Covid-19 pandemic (source: https://www.npr.org).
All of the recent repositionings of the global markets and forward expectations got us thinking about “what happens after 8 to 12+ months? How will the US and global markets attempt a recovery process – if at all?”. Today, we are going to try to start digging into the data that we believe is relevant to the future in terms of hard asset prices (home and other property) and more liquid asset prices (global financial markets).
First, we want to preface this article by stating that humans are somewhat predictable in terms of how they will react in emergency or panic situations like this current Covid-19 pandemic. Initially, they will react to protect what is vital to them (family, assets, safety). This same thing happened in the 2008-09 credit market crisis market collapse. Then, after a bit more time, people change their thinking and start to adapt to the situation as it unfolds. We believe that 30 to 60 days from now, as more information becomes available and consumers globally are more capable of addressing the true longer-term risks of this virus event, a social process will begin to take place where valuations and expectations will adjust to the new perceived outcome (whatever that may be).
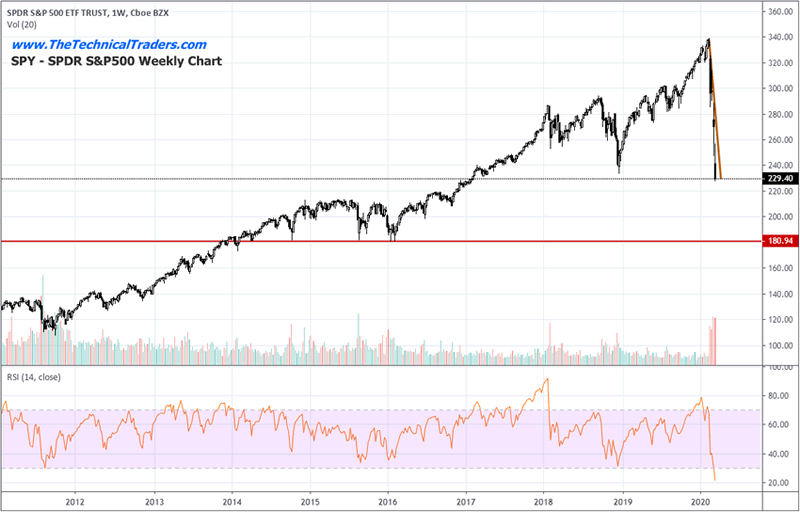
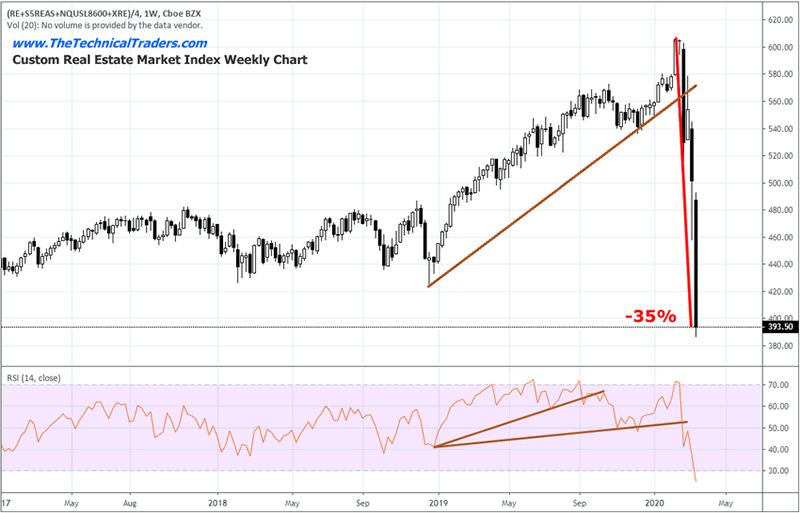
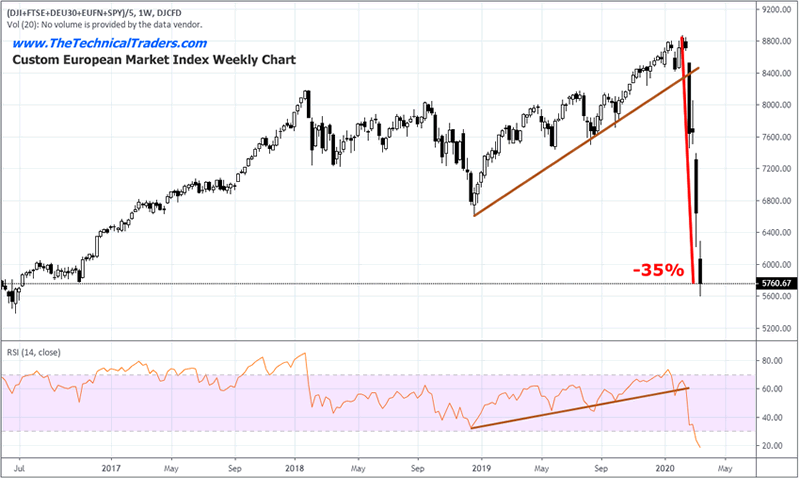
The global stock market has collapsed nearly -35% based on our Custom Indexes. The SPY has collapsed -32.25% since February 23, 2020. During the 2008-09 Credit Crisis, the SPY collapsed -57.50% before finding a bottom near $67.10. We believe this initial price decline in the global markets is just the first downside price collapse of what may become many. Ultimately, we believe the 2015/2016 lows will become the ultimate support for this downside move in the US markets.
Be sure to opt-in to our free market trend signals before closing this page, so you don’t miss our next special report!
SPY Weekly Chart
Custom Real Estate Index Weekly Chart
Custom European Index Weekly Chart
The data that is currently being reported and posted is data from January and February 2020. Current expectations for March data look grim (at best). Jobless claims, hours worked, and other economic data for the US and global markets may shock investors and the general public for many months to come. In 2008-09, these types of large economic contraction numbers were not uncommon. We want to prepare all of our friends and followers that we believe the next 6 to 12+ months could somewhat mirror what we saw in 2008-09 – be prepared.
If our assumptions are correct, the reprieve in Foreclosures and Mortgage repayments for US consumers may not do much to resolve the ultimate problem. The problem will quickly revolve around the issue of how quickly the US economy can resume somewhat normal functions after the virus event subsides. We believe the reprieve offered to US consumers will assist in making the data a bit more tolerable for a short period of time, but ultimately any extended disruption in the US and global economy will result in extended risks in hard assets like homes, commercial property, and future valuation expectations.
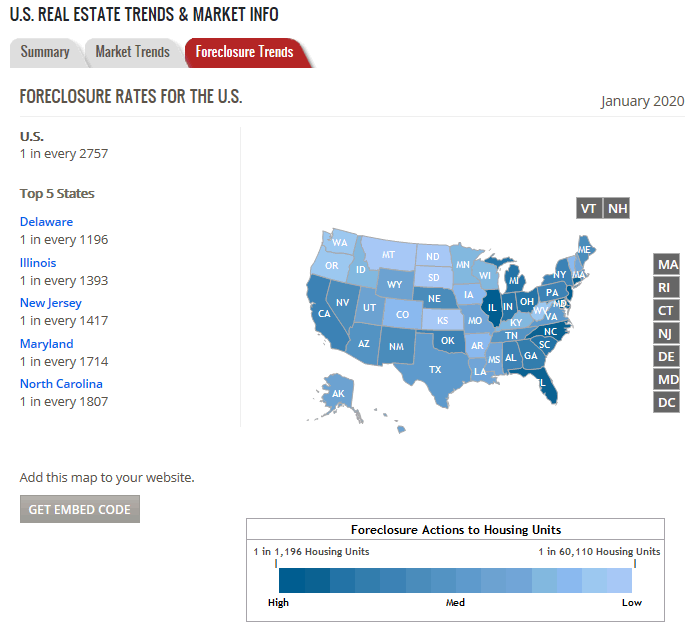
(Source: realtytrac.com/statsandtrends/foreclosuretrends/)
This multi-part research article will dig deeper into the data and expected data to help you prepare for what may be likely in the markets (hard and soft). Now is the time to prepare for what could become one of the biggest disruptions in the global markets and global society we’ve ever seen.
As a technical analysis and trader since 1997, I have been through a few bull/bear market cycles. I believe I have a good pulse on the market and timing key turning points for short-term swing traders.
Visit my ETF Wealth Building Newsletter and if you like what I offer, and ride my coattails as I navigate these financial markets and build wealth while others lose nearly everything they own during the next financial crisis.
Chris Vermeulen
www.TheTechnicalTraders.com
Chris Vermeulen has been involved in the markets since 1997 and is the founder of Technical Traders Ltd. He is an internationally recognized technical analyst, trader, and is the author of the book: 7 Steps to Win With Logic
Through years of research, trading and helping individual traders around the world. He learned that many traders have great trading ideas, but they lack one thing, they struggle to execute trades in a systematic way for consistent results. Chris helps educate traders with a three-hour video course that can change your trading results for the better.
His mission is to help his clients boost their trading performance while reducing market exposure and portfolio volatility.
He is a regular speaker on HoweStreet.com, and the FinancialSurvivorNetwork radio shows. Chris was also featured on the cover of AmalgaTrader Magazine, and contributes articles to several leading financial hubs like MarketOracle.co.uk
Disclaimer: Nothing in this report should be construed as a solicitation to buy or sell any securities mentioned. Technical Traders Ltd., its owners and the author of this report are not registered broker-dealers or financial advisors. Before investing in any securities, you should consult with your financial advisor and a registered broker-dealer. Never make an investment based solely on what you read in an online or printed report, including this report, especially if the investment involves a small, thinly-traded company that isn’t well known. Technical Traders Ltd. and the author of this report has been paid by Cardiff Energy Corp. In addition, the author owns shares of Cardiff Energy Corp. and would also benefit from volume and price appreciation of its stock. The information provided here within should not be construed as a financial analysis but rather as an advertisement. The author’s views and opinions regarding the companies featured in reports are his own views and are based on information that he has researched independently and has received, which the author assumes to be reliable. Technical Traders Ltd. and the author of this report do not guarantee the accuracy, completeness, or usefulness of any content of this report, nor its fitness for any particular purpose. Lastly, the author does not guarantee that any of the companies mentioned in the reports will perform as expected, and any comparisons made to other companies may not be valid or come into effect.
Chris Vermeulen Archive |
© 2005-2022 http://www.MarketOracle.co.uk - The Market Oracle is a FREE Daily Financial Markets Analysis & Forecasting online publication.