Precious Metals Are About To Reset Like In 2008 – Gold Bugs, Buckle Up!
Commodities / Gold & Silver 2020 Apr 07, 2020 - 11:10 AM GMTBy: Chris_Vermeulen
For years, many Gold Bugs (investors who’ve been advocating buying Gold and Silver at low prices as a hedge against future global economic risks) were shunned as conspiracy theorists and nuts. How could these people believe Gold and Silver were solid investments when the Global equities markets were rallying 5% a year consistently – what could go wrong?
Over the past two weeks, I have personally received multiple phone calls and emails from friends and associates asking how these people can suddenly ”buy physical metals”. In one case, this individual was purchasing Airline and Food Services stocks in late February thinking this move would be short-lived and telling me how the airlines would recover quickly after this is all over. Now, that person wants to know my secret contacts for buying physical metals.
If you know any Gold Bugs, you know we’ve built relationships with suppliers, friends and other Gold Bugs throughout the year. Believe it or not, I can still buy physical metals from a few of my closest associates in the industry. Eric Sprott is a fan of my precious metals forecasts and talked about my work a few times publicly. Eric owns SprottMoney.com. the other source is SDBullion.com. Both of these are my most trusted sources for buying physical gold and silver, I have never had any issues with them and customer support is top-notch!
Yes, the prices have begun to skyrocket a bit – Silver especially. But I can still buy physical metals because I have a deep resource of friends and suppliers.
What’s going to happen over the next few weeks is that more and more average people are suddenly going to realize they should have been buying metals as security against risk. Paper metals are going to explode as well, but physical metals will demand a premium that is much higher than paper/spot price. Right now, one ounce of Silver is going for about $21 to $25 per ounce in physical form (depending on my sources). The current SPOT price of silver is $14.50. That means the premium for physical Silver is between +45% to +75% right now in the open market.
Before we continue, be sure to opt-in to our free market trend signals before closing this page, so you don’t miss our next special report!
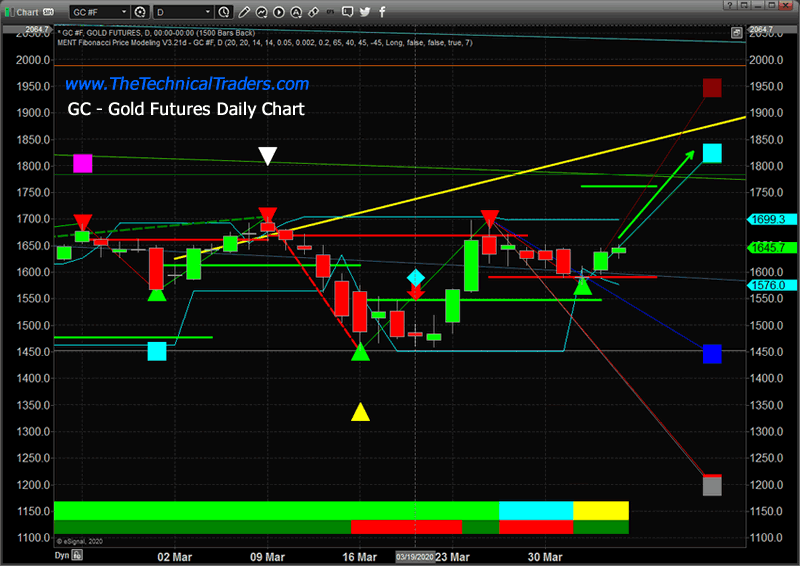
Daily Gold Chart
This Daily Gold chart highlights the upside Fibonacci price targets using our Adaptive Fibonacci Price Modeling system. We believe the next upside price target for Gold is $1825. A higher upside price target is visible on this chart near $1950 and we believe Gold prices will reach this level eventually. But we believe the current $1825 level is the immediate target. This would represent an immediate +10 upside price advance and would establish NEW HIGH prices for the past 9 years.

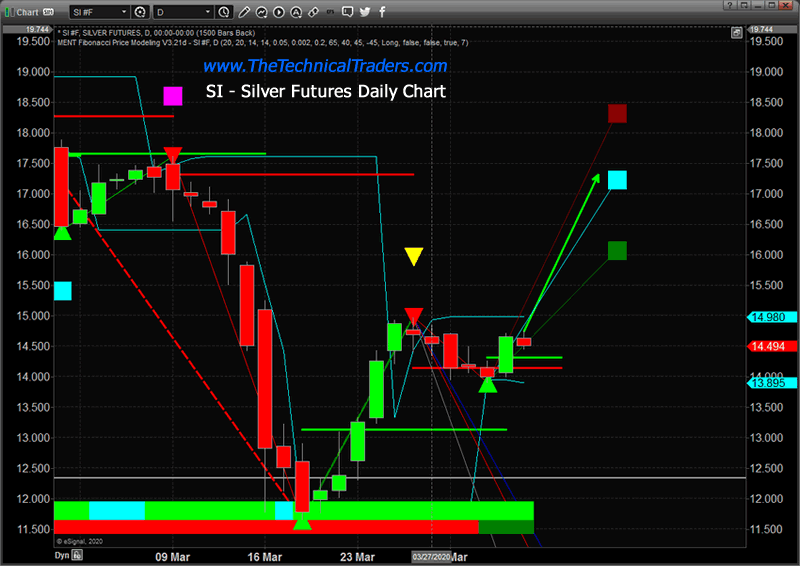
Silver Daily Chart
This Silver Daily chart also highlights our Adaptive Fibonacci Price Modeling system and shows an upside price target of $17.25. Remember, the current physical demand for Gold and Silver has skyrocketed over the past 2+ weeks. The Spot price is really not indicative of the open market price of physical at the moment. If Spot Silver moves to $17.25 as we predict, that would be a +19% upside price advance. If Silver advances to $18.25, that would be a +26% upside price advance.
You should also take a look at our silver chart from 1999 and what happened then, and should happen again now as well.

Silver Bugs are loving the setup right now because they know the pattern that sets up in the Metals market when a crisis hits. First, Gold begins to rally faster than Silver and the Gold to Silver ratio spikes higher. Then, once the shock-wave of the market crisis subsides, the metals begin a fairly usual price advance where both Gold and Silver advance – in unequal forms. This is when the real fun for Gold & Silver Bugs begins.
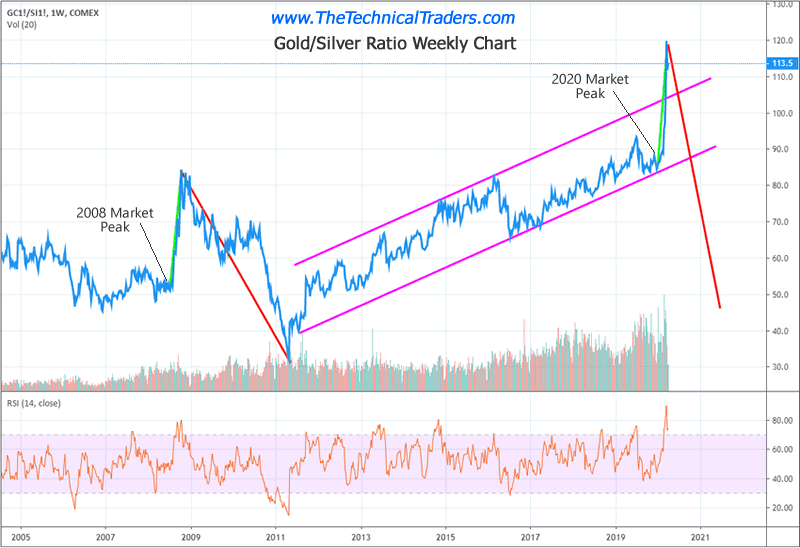
Gold to Silver Weekly Ratio Chart THE SILVER LINING
Take a look at this Gold to Silver Weekly Ratio chart. This chart measures how much one ounce Silver it takes to purchase one ounce of gold at current prices. Notice that spike in the ratio back in 2008? That was the spike in gold prices relative to Silver prices as the top formed in 2008 and the “shock wave” struck global investors. What happened? Everyone tried to pile into the Gold trade and ignored Silver for about 6+ weeks.
Then what happened to the Gold to Silver Ratio? It COLLAPSED from levels near 85 to a bottom hear 31. That means the price of Silver advance almost 3x faster than the price of Gold over that span. In order for the ratio to fall from near 90 to levels near 30, that indicates a very expansive price increase in the price of Silver.
Now, take a look at what has happened just recently in the Gold to Silver Ratio… another massive price spike. This time, the spike reached levels near 120 (Yikes). Can you guess why Gold and Silver Bugs are so excited right now? If another price advance takes place in precious metals which is similar to the 2008~2011 rally, Gold may see a 300% to 500% rally and Silver may see a 450% to 900% rally over the next 2 to 3 years.

View chart by TradingView.com
This is no joke. Physical metals are why Gold and Silver Bugs believe the value of having it in your hands is much better than owning an IOU from a broker or bank.
Get ready for some incredible price moves in the metals markets and congrats to all the Gold and Silver bugs out there. Our analysis says our patience and accumulation of physical metals will soon pay off in a big way.
As a technical analysis and trader since 1997, I have been through a few bull/bear market cycles. I believe I have a good pulse on the market and timing key turning points for short-term swing traders.
If you are a more active trader and swing trader visit my Active ETF Trading Newsletter. If you are a long-term investor looking for signals when to own equities, bonds, or cash, be sure to look into my Long-Term Investing Signals.
Ride my coattails as I navigate these financial markets and build wealth while others lose nearly everything they own during the next financial crisis.
Chris Vermeulen
www.TheTechnicalTraders.com
Chris Vermeulen has been involved in the markets since 1997 and is the founder of Technical Traders Ltd. He is an internationally recognized technical analyst, trader, and is the author of the book: 7 Steps to Win With Logic
Through years of research, trading and helping individual traders around the world. He learned that many traders have great trading ideas, but they lack one thing, they struggle to execute trades in a systematic way for consistent results. Chris helps educate traders with a three-hour video course that can change your trading results for the better.
His mission is to help his clients boost their trading performance while reducing market exposure and portfolio volatility.
He is a regular speaker on HoweStreet.com, and the FinancialSurvivorNetwork radio shows. Chris was also featured on the cover of AmalgaTrader Magazine, and contributes articles to several leading financial hubs like MarketOracle.co.uk
Disclaimer: Nothing in this report should be construed as a solicitation to buy or sell any securities mentioned. Technical Traders Ltd., its owners and the author of this report are not registered broker-dealers or financial advisors. Before investing in any securities, you should consult with your financial advisor and a registered broker-dealer. Never make an investment based solely on what you read in an online or printed report, including this report, especially if the investment involves a small, thinly-traded company that isn’t well known. Technical Traders Ltd. and the author of this report has been paid by Cardiff Energy Corp. In addition, the author owns shares of Cardiff Energy Corp. and would also benefit from volume and price appreciation of its stock. The information provided here within should not be construed as a financial analysis but rather as an advertisement. The author’s views and opinions regarding the companies featured in reports are his own views and are based on information that he has researched independently and has received, which the author assumes to be reliable. Technical Traders Ltd. and the author of this report do not guarantee the accuracy, completeness, or usefulness of any content of this report, nor its fitness for any particular purpose. Lastly, the author does not guarantee that any of the companies mentioned in the reports will perform as expected, and any comparisons made to other companies may not be valid or come into effect.
Chris Vermeulen Archive |
© 2005-2022 http://www.MarketOracle.co.uk - The Market Oracle is a FREE Daily Financial Markets Analysis & Forecasting online publication.


