


Credit Default Swaps Weapons of Financial Mass Destruction
Interest-Rates / Credit Crisis 2008 Oct 08, 2008 - 08:35 PM GMTBy: Gary_Dorsch

 The latest downward spiral in the global commodity and stock markets, coinciding with several high profile bank failures, is conjuring up fears of the calamities of the Great Depression of the 1930's. European and Asian stock markets are plunging as terror and panic hits Wall Street. The US Congress finally passed a massive $700 billion rescue package to unclog the credit markets, yet US stock markets have continued to plummet, shedding $1.5-trillion in value last week.
Hindsight is the best sight, but the chaos gripping the markets started with US Treasury's reckless decision to allow Lehman Brothers (LEH) to fail, which set-off an unstoppable chain reaction that unleashed a torrent of panic selling on global stock markets, and froze the European and US banking systems. LEH left its creditors holding $150 billion of near worthless bonds, and common and preferred shareholders were completely wiped out. “Until the day they put me in the ground I will wonder, why we were the only one that was not rescued,” former Lehman chief Larry Fuld told Congress on Oct 7 th .
However, there were also huge losses for companies who wrote credit protection on LEH's bonds over the past five-years. Those sellers of credit protection are now staring down the barrel of billions of dollars in claims, and are scrambling to raise money by selling anything they can get their hands on, including commodities and stocks. Warren Buffet has referred to these credit defaults swaps CDS's, as “weapons of financial mass destruction,” and the fuse on the time-bomb has been lit.
Many financial companies are on the hook for risky credit-default swaps, or private contracts that let firms bet in a completely unregulated market, on whether a borrower is going to default. When a bond default occurs, one party pays off the other for the principal amount. However, in an unregulated market, no one knows which bank issued these swaps. For OTC contacts, buyers of insurance rely on the counterparty to make good on their promises. Ominously, c redit-default swaps have mushroomed to $55 trillion today, up from $144 billion a decade ago.
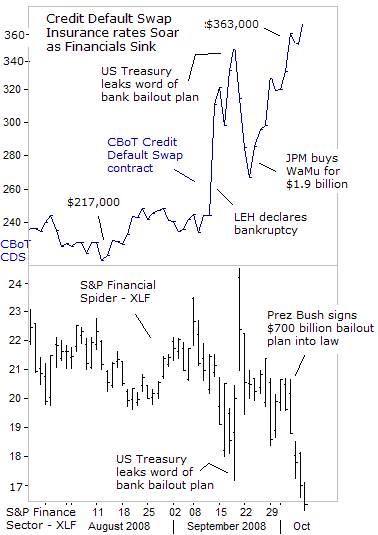
In contrast to the clandestine world of OTC trading, the Chicago Board of Trade launched a cash-settled and highly transparent credit default swap contract in June 2007, with the ticker “CX,” tracking the top-50 North American Investment Grade Bond Index. Hedge funds were particularly fond of selling these CDS contracts, when corporate defaults were at record lows over the past few years. That made selling CDS contracts a very profitable endeavor.
However, with the meltdown in the S&P financial sector, XLF, the CDS insurance for top investment grade companies at the CBoT has risen 50% in the past four weeks to around $363,000 per contract, reflecting the heightened risks from a sharp downturn in the US and global economy. Elsewhere, average high-grade corporate bond spreads hit an all-time high of 510 basis points over Treasuries this week, while junk spreads reached a record 1,300 basis points. Worse yet, the cost to insure $10 million of Morgan Stanley's 5-year bonds is $1.9 million plus $500,000 a year.
AIG, formerly the world's largest insurance company, had written credit-default swaps on more than $446 billion in credit assets, including mortgage securities, corporate loans and complex structured products. Last year, when sub-prime mortgage delinquencies triggered default swaps that AIG had insured, the firm was forced to book large write-downs. That spooked investors, who reacted by dumping its shares, and made it impossible for AIG to raise the capital it needed to survive. Without a Fed rescue for AIG, the CDS nuclear bomb would have exploded.
The New York Fed is aiming to rein-in the nuclear CDS market, by establishing a centralized credit default swap market with the Chicago Mercantile Exchange and London 's Intercontinental Exchange. The LEH bankruptcy has revived calls to move CDS trading onto an exchange trading floor, to remove the system risk posed by a counterparty failure, provide greater price transparency and offer simpler, more standardized settlement of contracts when an issuer defaults.
Higher Libor Rates Threaten Global Economy
The collapse in counterparty confidence, the fear of more bank failures, and the need to bolster balance sheets, has persuaded bankers to hoard their cash and stop lending money to each other, thus driving Libor rates sharply higher. Banks are afraid to lend money to other banks, fearful of which counterparty might have toxic mortgages or big CDS obligations on their books, thus undermining their survival prospects and ability to repay
The word “Libor” means nothing to most people, but it's at the very heart of the credit crisis and will have a direct impact on global commodity and stock markets, if credit markets remain ice cold. The London Inter-bank Offered Rate (LIBOR) is the interest rate at which large global banks are willing to lend money to each on a short-term basis. In place since the mid-1980s, it's calculated every business day in 10-currencies and 15-maturities, ranging from overnight to one-year.
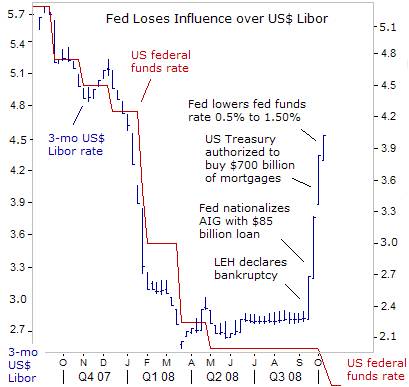
US-dollar Libor rate have surged by 175-basis points in the past four weeks to 4.5% today, due to the unrelenting fear that CDS time bombs can be ignited at any moment, especially as the European, Japanese, and US economies slide into a severe recession. Buyers of CDS's that are relying on receiving insurance payments in case of corporate bond defaults may also find themselves short changed.
The latest surge in Libor rates is very damaging to the US-economy, since interest rates on many business loans, all sub-prime home loans and 40% of prime adjustable rate home loans, ARM's, are pegged to the six-month Libor index plus percentage points. Earlier today, the Fed slashed the fed funds rate by a half-point to 1.50%, and five other central banks lowered their lending rates by a similar amount, in a desperate effort to cap the surge in the global Libor rates.
Bank of England rides to the Rescue
The Bank of England (BoE) had pegged its base lending rate at 5% since April, but since LEH declared bankruptcy on Sept 14 th the 3-month sterling Libor rate has jumped 50-basis points to 6.25% today. In the five-years before the revelations of the sub-prime debt crisis became evident in August 2007, the average spread between the BoE rate and 3-month sterling Libor was less than 20-basis points. After the BoE 0.50% rate cut to 4.5% today, the spread has widened to 175-basis points.
Three of the UK 's leading mortgage lenders have been forced to raise the cost of home loans by a quarter-point in the wake of the latest Libor surge. British banks are at greater risk if UK home values continue to plummet, which in turn, could trigger a new wave of mortgage defaults. British house prices fell -1.8% in August for the seventh straight month, to stand a record 12.7% lower than a year earlier, a sign the housing slide could turn into a bust. HBOS Plc, Britain 's biggest mortgage lender, said the global credit crunch made it much harder for people to get mortgage loans.
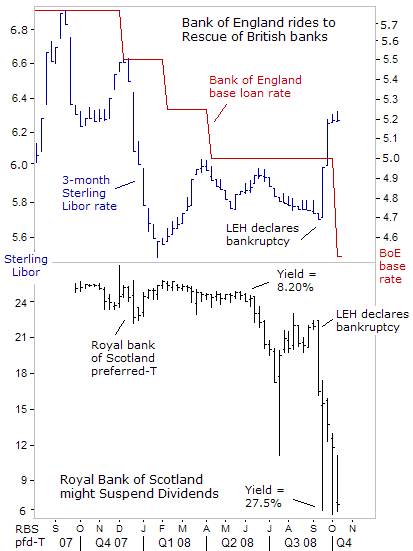
The Royal Bank of Scotland , the UK 's second largest bank with $1.5 trillion in loans outstanding, is seen as the weakest link in the UK banking sector. RBS's preferred stock, series-T, traded on the NYSE, melted down to $6 per share this week, lifting its current yield to 27.5%, signaling that RBS is locked out of the private credit markets, and can no longer borrow long-term money on its own devices.
In a coordinated move with other central banks, the BoE slashed its base lending rate by half-point to 4.50% on October 8th , but the rate cut had no impact on the sterling Libor rate, which held steady at 6.25%. In a new and innovative way to free up UK inter-bank markets , London will guarantee new debt issuance by banks for up to 250 billion pounds to help unfreeze Libor markets, and will inject 50-billion pounds of new capital immediately into banks with taxpayers' funds.
The plan also extends a BoE scheme that swaps banks' risky assets for government debt to provide 200 billion pounds of cash to the system. The package was quickly approved by the European Union, and looked likely to be mirrored in one way or another by other major European economies. Five-year credit default swaps on senior debt of RBS fell to 210 basis points after the plan was announced or about 60 basis points tighter from the previous day.
TED spread Soars to 21-year high
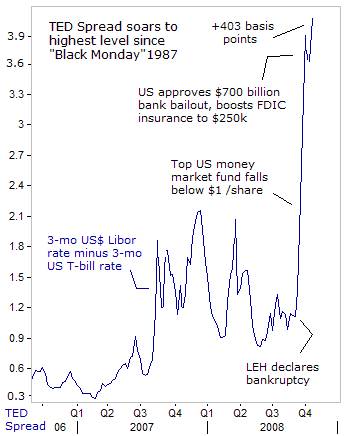
Today, the spread between the 3-month US Treasury yield and the 3-month LIBOR rate, popularly known as the TED Spread, widened to as wide as +400-basis points, its highest level since the 1987 stock market crash. The average spread over the past two years was 90-basis points. The TED Spread measures market stress by revealing the willingness or reluctance of banks to lend money to one another. A wide spread indicates that banks are in a panic, and are charging each other a bigger interest-rate premium than money lent to the US government.
Investors pulled a record $89.2 billion from US money-market funds on Sept 17 th , after the Reserve Primary Fund became the first money-market fund in 14-years to expose investors to losses, and sending the TED spread into orbit, as three-month US T-bills rates fell to as low as 2-basis points, the lowest since World War II. Meanwhile, Libor rates were heading higher, due to fears of CDS blow-ups.
To contain the TED spread's fire, Fed chief Ben Bernanke signaled on Oct 7 th , the central bank was ready to lower the fed funds rate as the credit freeze zaps US economic growth and inflation pressures subside. “Downside risks to growth have increased. Restricted flows of credit to households and businesses, and developments in financial markets pose a significant threat to economic growth. At the same time, the outlook for inflation has improved somewhat, though it remains uncertain,” Bernanke said.
The Fed is trying many different and innovative ways to prevent the financial system from melting down, including a new program to buy commercial paper that is not collateralized, in order to help thaw-out frozen credit markets. The commercial-paper market shrank to a three-year low of $1.6 trillion last week as investors even fled industrial companies with few links to the sub-prime mortgage crisis.
The Fed is also swapping $1 trillion of Treasuries with banks and dealers, in return for troubled assets and stocks, to head off a global liquidity squeeze against banks and borrowers. The Fed also increased its existing currency swaps with foreign central banks to $620 billion from $290 billion to make more US-dollars available worldwide, to alleviate the worst banking crisis since the Great Depression.
The key question at this point, is whether Fed rate cuts can knock US-dollar Libor rates lower, to help cushion the unrelenting slide in US-home prices, or is the Fed powerless to drive mortgage rates lower? The housing situation is grim. According to the Mortgage Bankers Association, 40% of sub-prime adjustable-rate mortgages are in foreclosure or had late payments, for prime adjustable-rate home loans the rate was 12% and for mortgages of all types it was 9.2% in the second quarter.
Tough Times ahead for Global Economy
“A recession in the US is looming, growth in Europe is weakening markedly, activity in Japan is cooling rapidly, and emerging countries have not decoupled from this downturn,” the International Monetary Fund warned in report ahead of the “Group of Seven” meeting this weekend. The three major economic trading blocs in Europe, Japan , and the US account for nearly two-thirds of the world's output.
“It is now all too clear we are seeing the most dangerous shock to mature financial markets since the 1930s, posing a major threat to global growth,” said Charles Collyns, director in the IMF's research department, on October 2 nd . “In particular, slowdowns or recessions preceded by bank-related stress tend to involve two to three times greater cumulative output losses and tend to last two to four times as long. Recapitalizing banks and responding quickly to the crisis were critical to alleviating such downturns,” the IMF said.
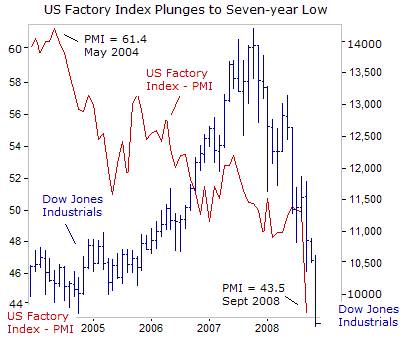
Booming US exports were the one bright spot in the US economic outlook, thanks to a weaker US-dollar. But with European and Japanese economies mired in recession, and emerging economies grinding to a halt, US exports could begin to falter. Meanwhile, the US factory activity plunged to its lowest since the 2001 recession, as the credit crunch strangles the world's largest economy. US consumer borrowing for big-ticket items plunged by $7.3 billion in August, the first decline since Jan 1998, amid tougher lending standards and declining consumer spending.
Making matters worse, US employers cut 159,000 jobs in September, as employment fell for a ninth straight month. In the factory sector, 73,000 jobs were lost in August, and 67,000 in July, the 27 th straight month of factory job losses. US auto sales also plunged 26% in September from a year earlier, with sales down as much as 34% at Ford Motor 32% at Toyota Motor and 37% at Nissan Motor.
“Fear Gauge” hits all-time highs
The worst banking crisis since the Great Depression, is ratcheting-up the level of fear and panic in the marketplace, to levels not seen in most traders' lifetime. The S&P-500, a key benchmark for global stock markets, plunged 15% in the first five-days of October, its biggest five-day rout since 1932. The S&P-500 closed below the psychological 1,000-level for the first time since 2003, extending its slide in 2008 to 32%, the worst annual slump since 1937.
The Dow Jones Industrials plunged to 9,447, to stand 33% below its record high set one-year ago, and it's the worst annual performance in 71-years. The stock market rout was led by Bank of America, the second largest US-bank, which plunged 26% in a single-day after it slashed its dividend in half to preserve cash, and plans to sell $10 billion in common stock as it braces for a deep economic recession. BAC's Q'3 profit plunged 68% to $1.18 billion, a quarter of the average estimate.
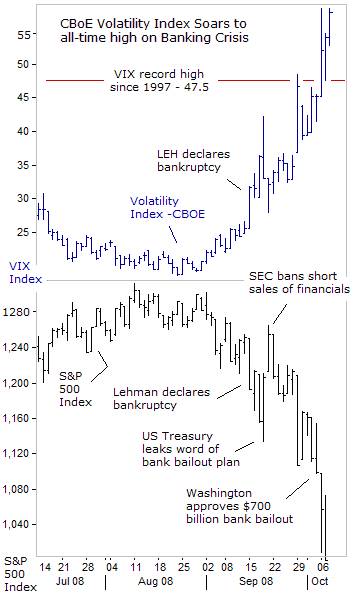
The CBOE Volatility Index - VIX, Wall Street's barometer of investor fear, also set a pair of new records, hitting an all-time record high of 58.24. Option volume in the S&P 500 index hit a high of 2.2 million contracts, and total option volume soared to a record 9.6 million. However, traders are most bullish at market tops and most bearish at market bottoms. Contrarians trade against the crowd, and buy when everyone else is selling and sell when everyone else is buying. A useful tool for contrarians to locate market tops, bottoms, and trend reversals is the CBOE Volatility Index. Some of the highest spikes on the VIX chart have correlated with the lowest depths of big stock market crashes, on extreme levels of fear.
Unwinding of “Yen carry Trades,” Gold is Safe Haven
While the fear of more CDS explosions in the future is freezing-up the global credit markets, the other weapon of mass destruction in the global markets is the unwinding of “yen carry” trades. The Japanese yen has been a star performer on the currency markets over the past few weeks, even with Japan's economy sliding deep into a recession, amid slumping exports, and the Nikkei-225 Index is plunging far below the psychological 10,000-level for the first time in five-years.
The Japanese yen has been the only currency to climb against the US-Dollar since August 1 st , even while the US $ has moved sharply higher against the Euro and other major foreign currencies. In fact, the yen's best gains have been against the higher-yielding currencies, the traditional targets of “carry trade” investors. The yen is +36% higher against the Brazilian real, +29% against the Australian dollar, +33% against the New Zealand kiwi, +16% vs the British pound, and zoomed +18% higher against the Euro, over the past nine weeks.
Traditionally, bubbles emerge in hotbeds of speculation, such as the commodity or stock markets. Some glaring examples this year were the spectacular rise and fall of the Shanghai stock market and the wild gyrations of crude oil and soybeans. But the yen's latest rally represents the busting of another bubble, this time in the currency markets. Japan sits at the epicenter of “bubble-mania” in the currency markets, and its yield starved investors plowed $6-trillion of their savings overseas.
Japanese investors increased their exposure to overseas assets by 59-trillion yen ($566 billion) last year, to a record 610-trillion yen ($5.9 trillion) , making Japan the world's largest creditor nation for the 17 th straight year. In addition, global speculators borrowed $1.2 trillion worth of Japanese yen, in order to buy higher yielding currencies, commodities, and stocks held abroad.
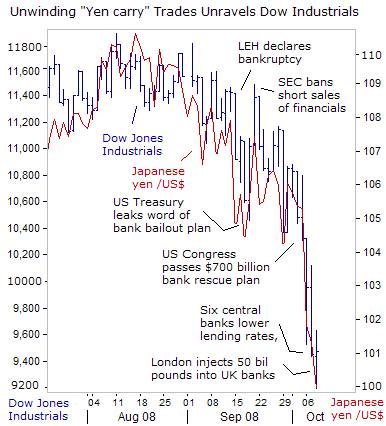
The “yen carry” trade is profitable while the US-dollar is climbing higher against the yen, and speculative appetites are juiced-up in the global stock markets. But the highly leveraged carry trade goes sour quickly, when the US-dollar is tumbling against the yen. Carry traders are quick to dump their speculative positions in foreign stock markets, when the yen is climbing, to avoid bruising foreign currency losses. When carry traders rush for the exits at the same time, the herd effect can create an avalanche of panic sales on global stock markets.
Over the past several years, carry traders inflated several emerging stock markets to astronomical heights, and also boosted more mature stock markets in the developed economies. But the unwinding of “yen carry” trades is a very destructive force to global stock markets, much like the Libor credit freeze, or the nuclear CDS time-bomb. The Dow Jones industrials have lost 1,600 points over the past five sessions, the biggest cumulative point loss on record for the blue-chip index. Along the way, the US-dollar plunged 5% against the Japanese yen.
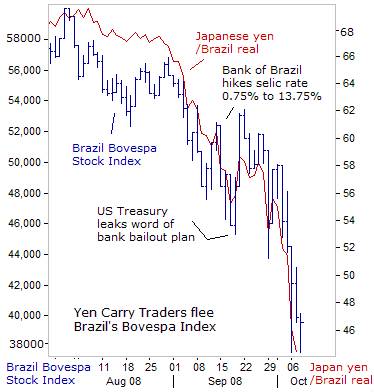
Brazil 's Bovespa stock index was a favorite haven for “yen carry” traders, as a play on the six-year bull-run for the “Commodity Super Cycle.” Latin America's largest economy is dominated by energy, grains, and raw materials, putting Brazil in the sights of “yen carry” traders' and the sweet spot for years. Diversified oil and ethanol giant Petrobras, CVRD, the world's second-largest mining company and the top miner of iron ore, along with several steel mills were the market leaders.
But commodities markets are heading for the biggest annual decline since 2001 and traders are exiting leveraged bets amid a synchronized global recession, which erodes demand for raw materials. The Reuters-Jefferies CRB Index has lost $280.6 billion, or 44%, from its July 3 peak, and the demand for Brazilian exports is adversely affected. As a result, Brazil 's high-flying stock market and currency have been battered with “yen carry” traders yanking money from emerging markets.
The Sao Paulo Stock Index has lost half of its market value since reaching an all-time in May. Brazil 's currency, the real, has plunged by 34% against the Japanese yen, even though Brazil is a net creditor for the first time, meaning it amassed more foreign currency reserves than all of its foreign debt. The Bank of Brazil's overnight loan rate is 13.25% higher than the Bank of Japan's, yet the wide interest rate spread, didn't prevent the Brazilian real from plunging against the yen.
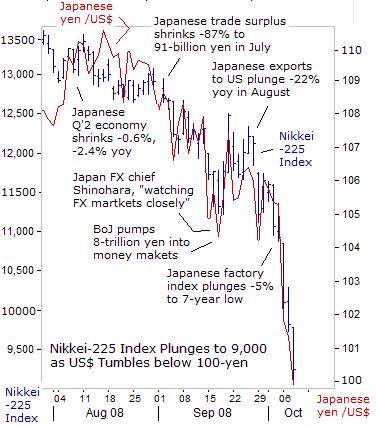
Unwinding of “yen carry” trades lifted the Japanese yen to multi-years highs against the currencies of Japan 's major trading partners, which could inflict a severe blow to Nikkei-225 exporters. The Nikkei average plunged 9.4% on October 7 th , its biggest daily drop since the 1987 stock market crash, as growing fears of a global recession led investors to wipe $250 billion off the value of Tokyo shares to $2.835-trillion. Toyota Motor tumbled 11% on a sharply lower outlook for profits.
The Nikkei-225 set another five-year closing low, briefly hitting 9,055, and has lost 19% in the past five days, and is 47% lower from a year ago. Although Japanese banks have relatively little exposure to toxic sub-prime debt, other glaring warning signals for the Nikkei have been flashing for quite some time. Japan 's trade balance fell into a deficit in August for the first time since 1982, as high oil prices ramped up import costs while exports slowed to a crawl, adding to the pain of an economy already stuck in a severe recession. Japanese shipments to the US plunged a record -21.8% yoy in August, marking the 12 th straight month of annual declines.
Yet the Bank of Japan said on Oct 8 th , did not join the other six central banks that slashed rates a half-point in a historic coordinated move. “We do not think that an interest rate of 0.5% is not accommodative enough. It's not that we would like to adopt a quantitative easing policy or that we see a need for further monetary easing,” said Hirohide Yamaguchi, the BOJ executive director of monetary policy.
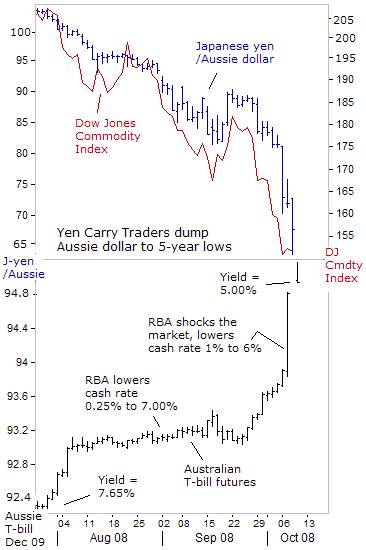
With the Bank of Japan opting to leave its rates steady, “yen carry” traders responded by hammering the Australian dollar to 65-yen, a five-year low, plunging 20% in just three-days, while governments and central banks across the world scrambled to rescue banks from collapse by guaranteeing bank deposits, and injecting tens of billions of dollars to thaw-out frozen credit markets. Unwinding of “yen carry” trades also slammed South Korea 's won to 1,398 against the dollar, the lowest in a decade, amid a stampede from the Kospi index.
With the outlook for the global economy and demand for commodities deteriorating, Aussie futures traders are pricing more rate cuts by the Reserve Bank of Australia (RBA) before year-end, adding to the Aussie's troubles. Aussie T-bill futures enjoyed their biggest single-day rally on record on October 7 th , and fully expect a 50-basis point RBA rate cut to 5.50% in November, just a day after the RBA shocked the markets, by slashing its cash rate 100-basis points to 6.0 percent.
Because of historically high oil prices, Persian Gulf sovereign wealth funds belonging to Kuwait , Qatar , Saudi Arabia and the United Arab Emirates , amassed $1 .5 trillion at the end of last year. Yet that's only one-fourth the size of assets held overseas by Japanese investors, making the “yen carry” trade one of the most feared weapons of mass destruction in global currency, commodity and stock markets.
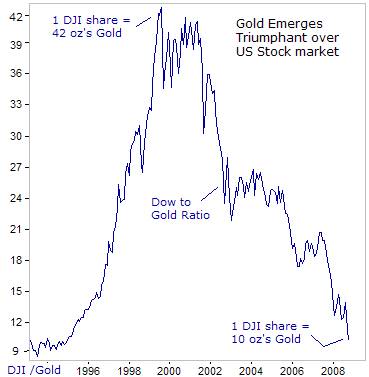
The epic battle between the gold bugs and the stock market bulls has now gone full circle, with gold emerging triumphant. Since the sub-prime debt crisis began to take the markets by storm last summer, one share in the Dow Jones Industrials has lost half of its value compared to an ounce of gold, the least amount since 1994. With governments nationalizing their financial institutions, to prevent widespread panic, the money printing press might be the only way out of the ugly mess.
This article is just the Tip of the Iceberg of what's available in the Global Money Trends newsletter. Subscribe to the Global Money Trends newsletter, for insightful analysis and predictions of (1) top stock markets around the world, (2) Commodities such as crude oil, copper, gold, silver, and grains, (3) Foreign currencies (4) Libor interest rates and global bond markets (5) Central banker "Jawboning" and Intervention techniques that move markets.
By Gary Dorsch,
Editor, Global Money Trends newsletter
http://www.sirchartsalot.com
GMT filters important news and information into (1) bullet-point, easy to understand analysis, (2) featuring "Inter-Market Technical Analysis" that visually displays the dynamic inter-relationships between foreign currencies, commodities, interest rates and the stock markets from a dozen key countries around the world. Also included are (3) charts of key economic statistics of foreign countries that move markets.
Subscribers can also listen to bi-weekly Audio Broadcasts, with the latest news on global markets, and view our updated model portfolio for Q'1, 2008. To order a subscription to Global Money Trends, click on the hyperlink below, http://www.sirchartsalot.com/newsletters.php or call toll free to order, Sunday thru Thursday, 8 am to 9 pm EST, and on Friday 8 am to 5 pm, at 866-553-1007. Outside the call 561-367-1007.
Mr Dorsch worked on the trading floor of the Chicago Mercantile Exchange for nine years as the chief Financial Futures Analyst for three clearing firms, Oppenheimer Rouse Futures Inc, GH Miller and Company, and a commodity fund at the LNS Financial Group.
As a transactional broker for Charles Schwab's Global Investment Services department, Mr Dorsch handled thousands of customer trades in 45 stock exchanges around the world, including Australia, Canada, Japan, Hong Kong, the Euro zone, London, Toronto, South Africa, Mexico, and New Zealand, and Canadian oil trusts, ADR's and Exchange Traded Funds.
He wrote a weekly newsletter from 2000 thru September 2005 called, "Foreign Currency Trends" for Charles Schwab's Global Investment department, featuring inter-market technical analysis, to understand the dynamic inter-relationships between the foreign exchange, global bond and stock markets, and key industrial commodities.
Copyright © 2005-2008 SirChartsAlot, Inc. All rights reserved.
Disclaimer: SirChartsAlot.com's analysis and insights are based upon data gathered by it from various sources believed to be reliable, complete and accurate. However, no guarantee is made by SirChartsAlot.com as to the reliability, completeness and accuracy of the data so analyzed. SirChartsAlot.com is in the business of gathering information, analyzing it and disseminating the analysis for informational and educational purposes only. SirChartsAlot.com attempts to analyze trends, not make recommendations. All statements and expressions are the opinion of SirChartsAlot.com and are not meant to be investment advice or solicitation or recommendation to establish market positions. Our opinions are subject to change without notice. SirChartsAlot.com strongly advises readers to conduct thorough research relevant to decisions and verify facts from various independent sources.
Gary Dorsch Archive |
© 2005-2022 http://www.MarketOracle.co.uk - The Market Oracle is a FREE Daily Financial Markets Analysis & Forecasting online publication.