


How Chart Price Gaps Help Market Traders Hit the "TARGET" of Opportunity
InvestorEducation / Learn to Trade Apr 23, 2020 - 05:20 PM GMTBy: EWI
 Here's how a bearish price gap on Target's chart foretold of the retail giant's Q1 2020 nosedive
As many of us continue the process of working from home, isolated with young children and significant others day in and day out, the subject of price gaps feels paradoxically fitting.
Here's why: After countless hours of sharing the same tight-knit space of finger-painting on the walls, dirty dishes, and zero social outlet, in comes your partner. You nervously ask, "Are you okay?" To which she replies with the most frightening of all four-letter "F" words,
I'm "F-I-N-E"
And that's when you know it's time to brace for impact.
"FINE," in its vacant hollowness, is the equivalent of a gap on a price chart. They are generated in extremely tense, emotional market environments when a spike in volume and volatility makes prices jump so fast that they leave an empty space on the chart.
Indeed, in today's emotional market environment, price gaps are everywhere, from bonds to bitcoin to big tech and beyond:
- "Price Gap Triggers Fear for Bond ETF's" (March 29 Yahoo! Finance)
- "A CME Gap at $3500 Leaves Bitcoin Vulnerable" (April 14 Bitcoinist)
- "Apple Gaps Below Key Moving Average." (April 2 The Street)
The question is, can you somehow use price gaps for your trading or investment decisions?
The short answer is, yes. A longer answer comes via Elliott Wave International's Trader's Classroom instructor Jeffrey Kennedy. Over the past few months, Jeffrey has built a strong, evidence-based case in favor of price gaps and their ability to clarify two main facets of a price trend:
- The strength of the trend, and
- Where prices are within their Elliott wave pattern
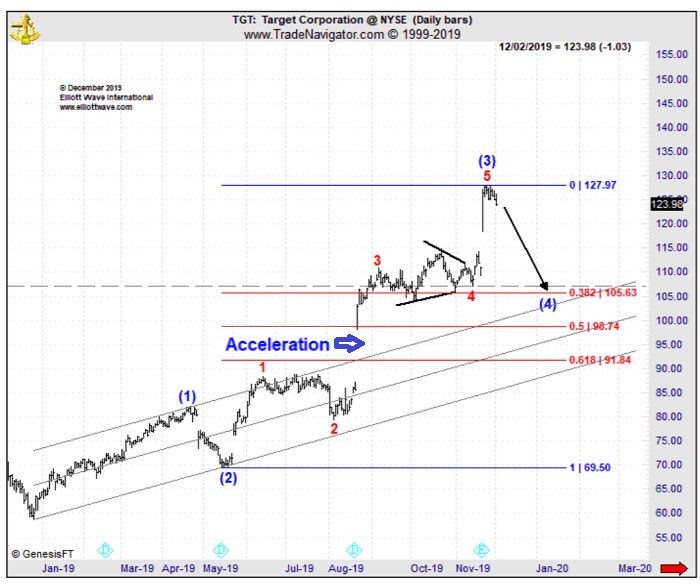
Case in point: Target, TGT. Early last December, well before the market mayhem, Jeffrey recognized a series of price gaps on TGT's charts. At the time, TGT was orbiting lifetime highs and mainstream analysts saw no end to the stock's upside, as this December 6, 2019 Yahoo! Finance confirms:
"Target (TGT) has been a star... The stock price keeps hitting new highs with its unending rally. Analysts continue to raise EPS estimates for TGT, propelling this stock into a Zacks Rank #1 (Strong Buy)."
In his December 3, 2019 Trader's Classroom, however, Jeffrey identified a so-called acceleration gap in the stock's August advance, a strong indication of third-of-third wave price action. That made the latest push higher a likely 5th wave and meant that the rally was closer to its end than its beginning, prompting this bearish forecast:
"The next sequence of events would be a pullback that could go into April," labeling common Fibonacci target for the decline.
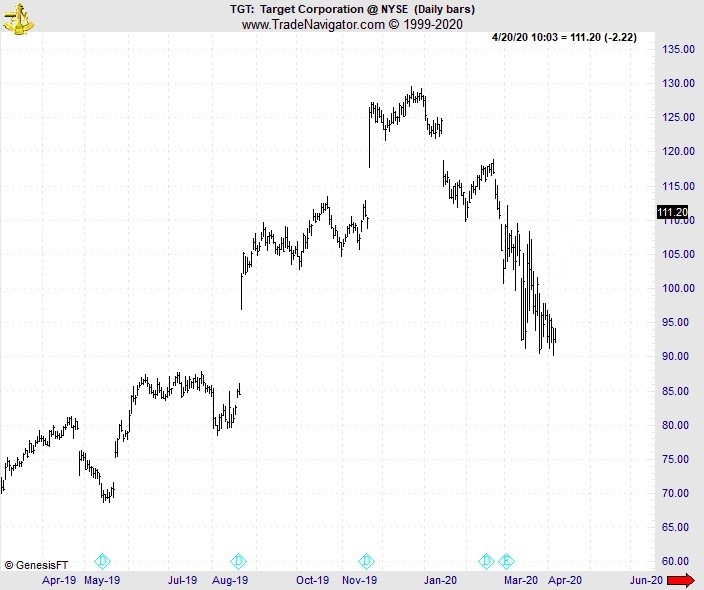
The next chart shows what followed: In late December, Target turned down from an all-time high plummeting 25% before stopping at a seven-month low on March 25:
That was just one example of (very) many. Price gaps enhance your understanding of the Elliott wave pattern underway. They can also join forces with other technical tools to facilitate high-confidence forecasts.
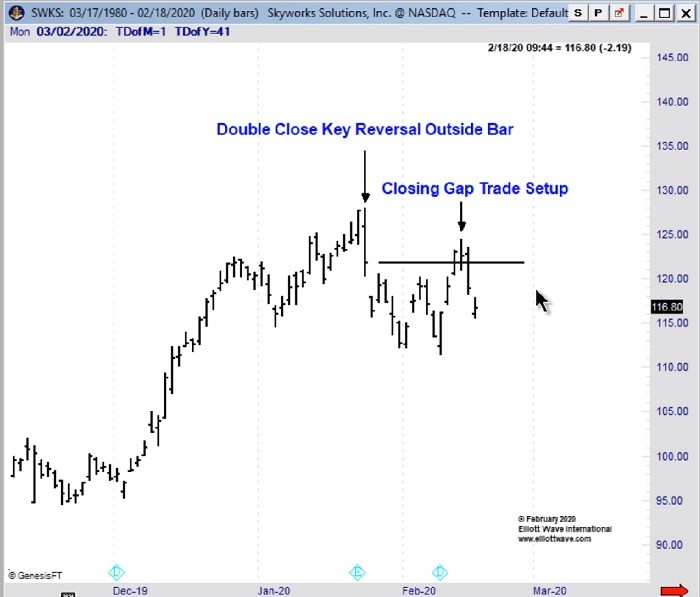
Here's one more for you. In his February 18 Trader's Classroom, Jeffrey identified a bearish key reversal pattern and price gap on the chart of Skyworks Solutions, Inc. (ticker symbol: SWKS). Jeffrey told subscribers that,
"the risk is to the downside and we'll see further decline."
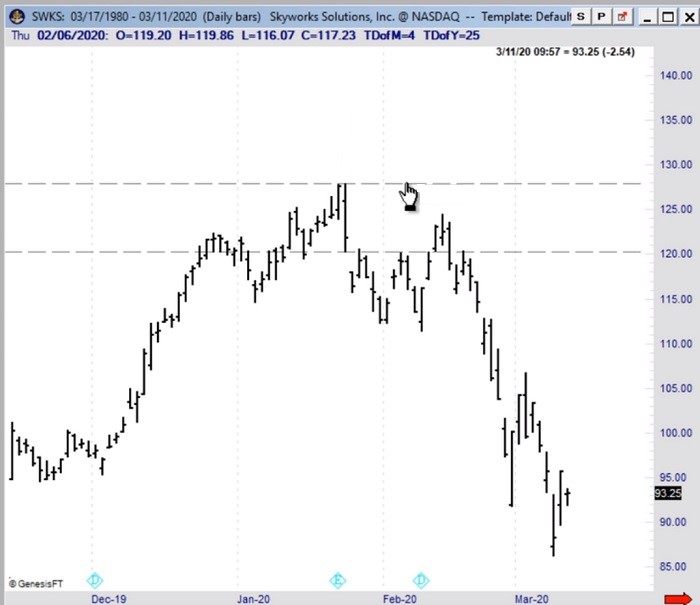
What happened next?
Well, in Elliott Wave International's brand-new, free educational video titled "See a Price Gap? Learn to Capitalize on Them," Jeffrey revisits Skyworks Solutions and shows you the outcome of his original bearish forecast:
You can see it all for yourself in Jeffrey's video lesson, where he covers these critical bases:
- What is a price gap?
- What are the 4 types of price gaps and when do they occur?
- Which price gaps coincide with specific substructures of an Elliott wave impulse pattern?
- What is the "closing the gap" trade set-up, and how is it used to identify high-confidence turns?
It's time to take your trading technique from "FINE" to fortified.
The best part is, Elliott Wave International is offering "See a Price Gap? Learn to Capitalize on Them" for FREE to all our Club EWI members.
Take 30 seconds to get instant access.
This article was syndicated by Elliott Wave International and was originally published under the headline How Price Gaps Help Traders Hit the "TARGET" of Opportunity. EWI is the world's largest market forecasting firm. Its staff of full-time analysts led by Chartered Market Technician Robert Prechter provides 24-hour-a-day market analysis to institutional and private investors around the world.
© 2005-2022 http://www.MarketOracle.co.uk - The Market Oracle is a FREE Daily Financial Markets Analysis & Forecasting online publication.