


XLF Financial Sector Stocks ETF May Break Below Price Gap
Companies / Banking Stocks Jun 18, 2020 - 10:32 AM GMTBy: Chris_Vermeulen

Our research team warned of a peak in the Financial Sector ETF on June 10, 2020, with this article.
It was important to understand the technical setup that existed at that time and what the Fibonacci Price Modeling system was showing then. There was very clear support near $23 that was highlighted by the Fibonacci Price Modeling System and we were very clear in our future price predictions within that article…
“The $27 price peak sets up directly between our two Fibonacci Daily upside price target (Peak) levels. We believe this setup is a very strong indication that a move to below $23 may be setting up over the next 30+ days. The Q2 data may very well push investors to re-evaluate the potential for the Financial sector if delinquencies and at-risk borrowers continue to default in greater numbers. “
The timing of our original article could not have been better for skilled technical traders. Since that June 10, 2020 article posted, the XLF price has fallen almost exactly to $23 (-10.15%).
Currently, the FLX price is recovering just above the price gap that will act as the next “window” for the price to attempt to fill. Skilled technical traders should watch the Breakdown Gap that setup between June 10 and June 11 as an upper window of resistance (between $25.20 and $24.35). It is very likely that the XLF price may attempt to breach or fill this gap window before initiating another downside price move targeting levels below $22.
Before you continue, be sure to opt-in to our free-market trend signals before closing this page, so you don’t miss our next special report!
DAILY XLF CHART
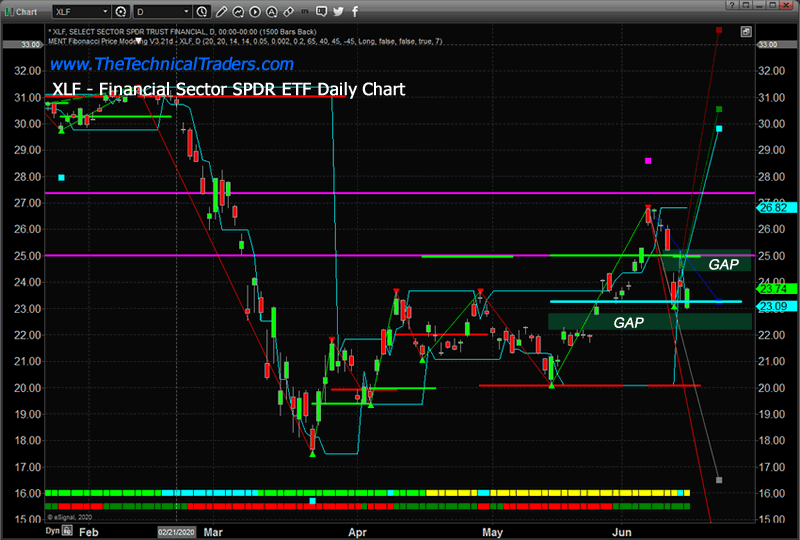
It is our opinion that should sudden price weakness drive price levels lower, away from the upper gap range, then weakness in the financial sector could create a series of new lower price gaps as XLF price levels attempt to gap downward – through $22, then $20, then ultimately the $18 to $19 price level.
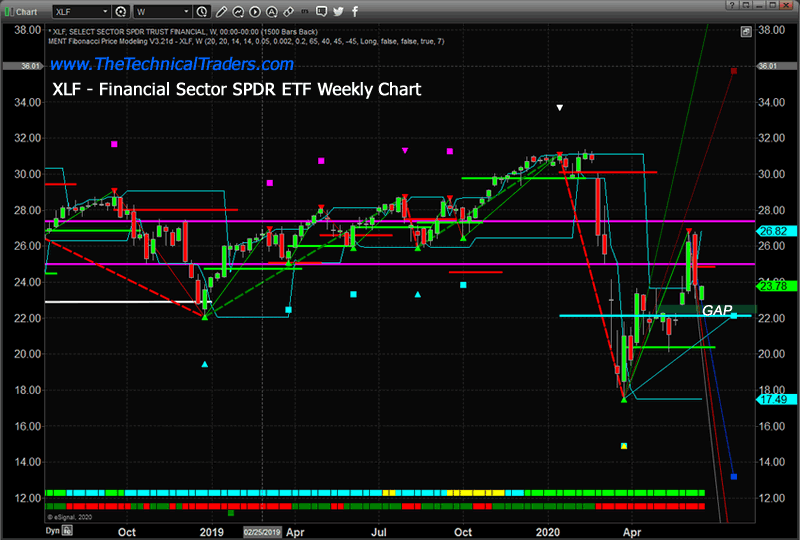
This Weekly XLF chart highlights the longer-term Fibonacci Price Modeling System’s expectations showing the current downside price move has broken below the Bearish Fibonacci Price Trigger Level near $24.87. At this point, the next lower support level is near $22.10 – just below the lower Gap level.
It is our opinion that the Financial Sector ETF will attempt to break below $22 in the near future and may attempt to fall to levels near or below $20. The current support in the market from the $23 level may prompt a move into the upper Gap level before the next downside move begins – although we feel that is not likely to happen.
WEEKLY XLF CHART
Watch for a breakdown in price trading below $23.50 as an indication that weakness has prompted price to trade below the recent “Belt-Line” price level. We believe a new close below $23.50 would be a good indication that the lower Gap is about to be filled and a deeper price move may take place targeting $20 to $21.
As the Q2 data starts to hit the news wires over the next 4+ weeks, we believe risks to the financial system will become very evident as a result of the COVID-19 shutdown. Be prepared for increased volatility in almost all sectors and the very real potential for a retest of recent low price levels.
As a technical analyst and trader since 1997, I have been through a few bull/bear market cycles in stocks and commodities. I believe I have a good pulse on the market and timing key turning points for investing and short-term swing traders. 2020 is an incredible year for traders and investors. Don’t miss all the incredible trends and trade setups.
Subscribers of my Active ETF Swing Trading Newsletter had our trading accounts close at a new high watermark. We not only exited the equities market as it started to roll over in February, but we profited from the sell-off in a very controlled way with TLT bonds for a 20% gain. This week we closed out SPY ETF trade taking advantage of this bounce and entered a new trade with our account is at another all-time high value.
Ride my coattails as I navigate these financial markets and build wealth while others watch most of their retirement funds drop another 35-65% during the rest of this financial crisis going into late 2020 and early 2021.
Just think of this for a minute. While most of us have active trading accounts, what is even more important are our long-term investment and retirement accounts. Why? Because they are, in most cases, our largest store of wealth other than our homes, and if they are not protected during the next bear market, you could lose 25-50% or more of your net worth. The good news is we can preserve and even grow our long term capital when things get ugly like they are now and ill show you how. One of the best trades is one your financial advisor will never let you do because they do not make money from the trade/position but we do have a way for you or your advisor can take advantage of the market gyrations with our Technical Wealth Advisor investing signals.
If you have any type of retirement account and are looking for signals when to own equities, bonds, or cash, be sure to become a member of my Passive Long-Term ETF Investing Signals which we issued a new signal for subscribers.
Chris Vermeulen
www.TheTechnicalTraders.com
Chris Vermeulen has been involved in the markets since 1997 and is the founder of Technical Traders Ltd. He is an internationally recognized technical analyst, trader, and is the author of the book: 7 Steps to Win With Logic
Through years of research, trading and helping individual traders around the world. He learned that many traders have great trading ideas, but they lack one thing, they struggle to execute trades in a systematic way for consistent results. Chris helps educate traders with a three-hour video course that can change your trading results for the better.
His mission is to help his clients boost their trading performance while reducing market exposure and portfolio volatility.
He is a regular speaker on HoweStreet.com, and the FinancialSurvivorNetwork radio shows. Chris was also featured on the cover of AmalgaTrader Magazine, and contributes articles to several leading financial hubs like MarketOracle.co.uk
Disclaimer: Nothing in this report should be construed as a solicitation to buy or sell any securities mentioned. Technical Traders Ltd., its owners and the author of this report are not registered broker-dealers or financial advisors. Before investing in any securities, you should consult with your financial advisor and a registered broker-dealer. Never make an investment based solely on what you read in an online or printed report, including this report, especially if the investment involves a small, thinly-traded company that isn’t well known. Technical Traders Ltd. and the author of this report has been paid by Cardiff Energy Corp. In addition, the author owns shares of Cardiff Energy Corp. and would also benefit from volume and price appreciation of its stock. The information provided here within should not be construed as a financial analysis but rather as an advertisement. The author’s views and opinions regarding the companies featured in reports are his own views and are based on information that he has researched independently and has received, which the author assumes to be reliable. Technical Traders Ltd. and the author of this report do not guarantee the accuracy, completeness, or usefulness of any content of this report, nor its fitness for any particular purpose. Lastly, the author does not guarantee that any of the companies mentioned in the reports will perform as expected, and any comparisons made to other companies may not be valid or come into effect.
Chris Vermeulen Archive |
© 2005-2022 http://www.MarketOracle.co.uk - The Market Oracle is a FREE Daily Financial Markets Analysis & Forecasting online publication.