


Stock Market Short-term Trend Lines in Focus
Stock-Markets / Stock Markets 2020 Sep 02, 2020 - 06:18 PM GMTBy: Andre_Gratian

Current Position of the Market
SPX Long-term trend: For now, the best guesstimate is that we are still in the bull market which started in 2009.
SPX Intermediate trend: We should be approaching an important high, with confirmation coming over the near term.
Analysis of the short-term trend is done daily with the help of hourly charts. It is an important adjunct to the analysis of daily and weekly charts which discuss longer market trends.
Daily market analysis of the short-term trend is reserved for subscribers. If you would like to sign up for a FREE 4-week trial period of daily comments, please let me know at anvi1962@cableone.net
Short-term Trend Lines in Focus
P&F target for near-term top: SPX progressed to the next projection of ~3500 (met)
Cycles: Since the inversion of the 40-wk cycle, short-term cycles have only provided brief and shallow pullbacks. The same is expected of the 36-td cycle due early next week.
Market Analysis (Charts courtesy of QCharts
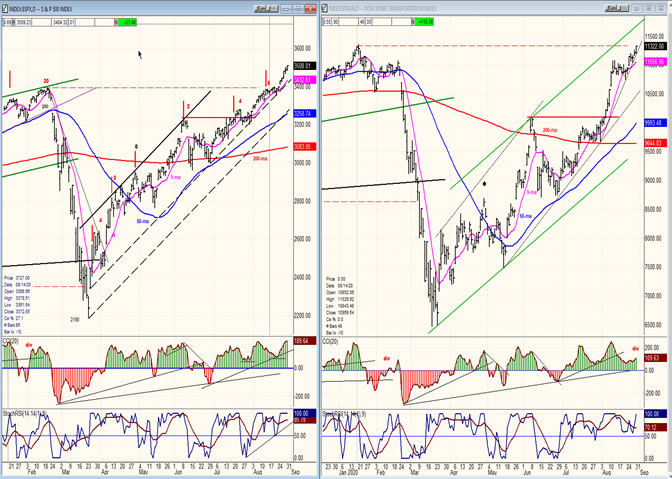
SPX-TRAN daily charts:
Since the clear warning that came ahead of the March correction, TRAN has only issued minor alerts and, although it remains the laggard on a long-term basis, it has shortened its lag time, especially since the beginning of August. This would suggest that there is no serious correction directly ahead. While there is no discrepancy between prices, the TRAN oscillators show more weakness than SPX’s. This could be another form of warning.
Incidentally IWM, the other leading index followed, is far weaker than TRN, which poses a dilemma as to which of the two is the most reliable at predicting reversals in SPX.
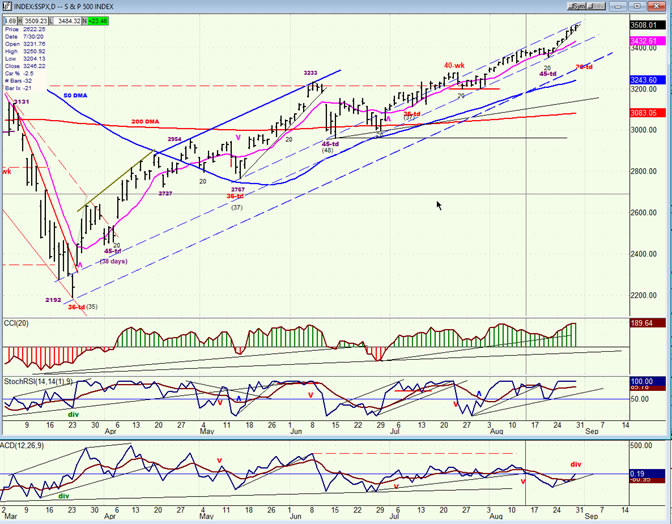
SPX daily chart
Beginning with the March low, SPX formed a broad, bullish channel. After the June correction, the channel narrowed considerably, especially in August. This is mostly due to the influence of NDX which rose with no correction to speak of since August 10. As we know, SPX is essentially a hybrid index between NDX and DJIA. That being said, QQQ (an ETF tracking NDX), which had a high of 293.85 on Thursday, may be reaching an important intermediate projection target of 294-296 and appears to be already engaged in distribution between 290 and 293. If so, a correction in QQQ would also occur in SPX. DJIA may also be in the process of ending a move which started after the June correction. A concerted top between QQQ and DJIA would be ideal to create the first significant retracement in SPX since June. Perhaps this is the warning being issued by the lagging IWM.
Something of which we can be certain is that the A-Ds have been lagging significantly over the past couple of weeks. That is a sign that the broad market is not keeping up and it is usually a warning that a correction is not far away. On the hourly chart, we will take a look at short-term trend lines which may be close to being broken.
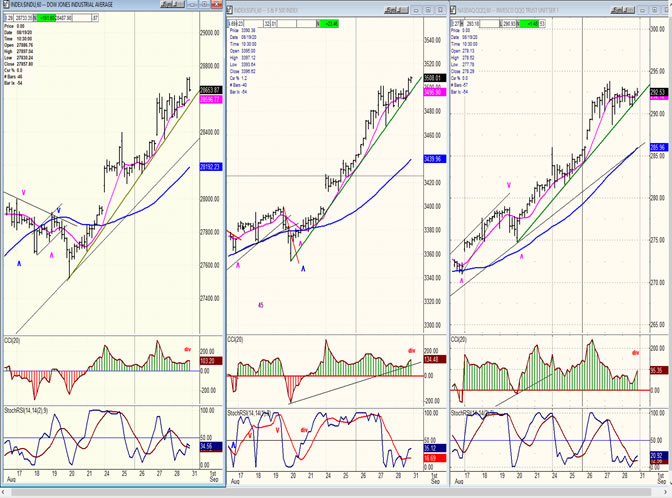
SPX hourly chart
I have posted the hourly charts of DJIA, SPX and QQQ below. You can see why the title of this letter is “Short-term Trend Lines in Focus”. It would not take much for a short-term correction to start; all that is required is that these steep trend lines be violated, and it could happen at any time! In addition, you will notice that all three CCIs are showing negative divergence, and all three SRSIs are already negative. If the three indices do correct over the near term as the 36-td cycle makes its low, it would only lead to a minor correction. There are longer trend lines below which should support prices and we cannot expect a deeper reversal until those are broken. Also, there is no important congestion pattern that has formed which is suggestive of a significant reversal at this time, although both SPX and QQQ may have started building one after reaching their projection targets.
Since the March low, the market has shown continued strength and has paid no attention to the economic disturbances caused by the pandemic. But we are about to enter the month of September which has the dubious reputation of being the weakest month of the year for stocks, so seasonality may cause a pause in the uptrend, with the breaking of the trend lines shown giving us the first warning.
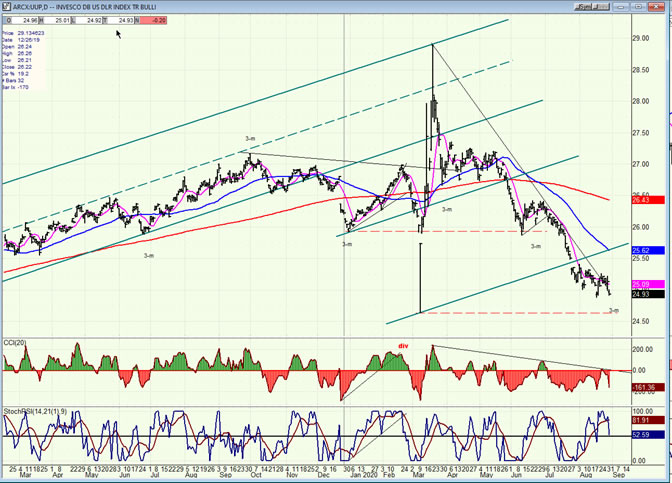
- UUP (dollar ETF) ($USD chart not available from this data provider)
- UUP has not been able to break its downtrend line and pulled back once again in what could be a retest of the low. The index is also near its 3-mo cycle low which has regularly impacted its price pattern in the past. If it can hold this level for the next few days, it will have started a base and will be ready for a rally, assisted by the up-phase of the 3-mo cycle.
-
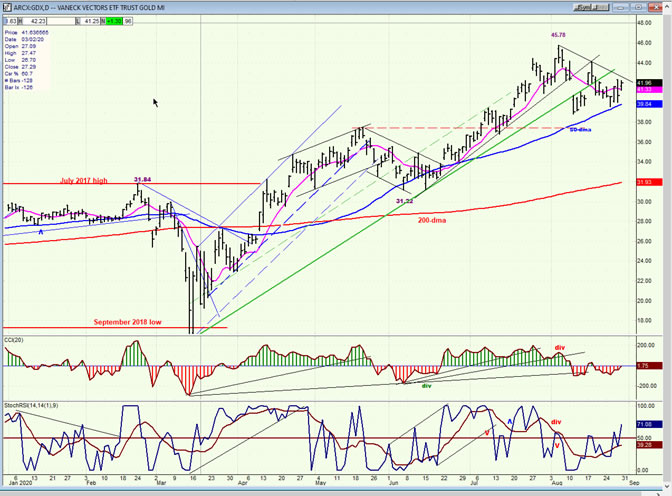
- GDX (gold miners)
- GDX has found support on its (blue) 50-dma and has tested it twice since its recent high. It is not clear if it has completed its correction and is ready to resume its long-term uptrend. I suspect that after the extent of its recent move, more consolidation is needed. Dropping below the 50-dma would confirm it.
-
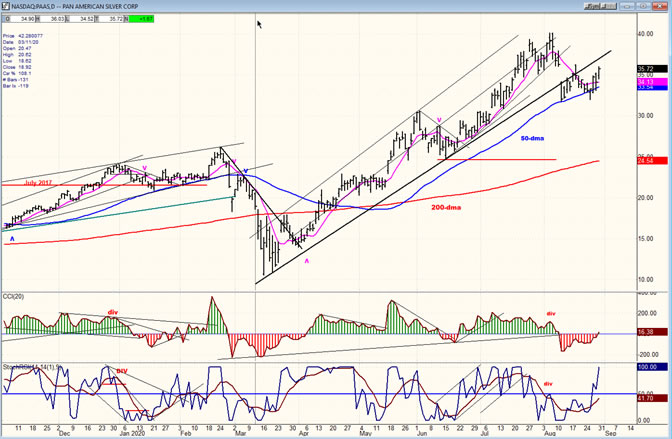
- PAAS (Pan American Silver Corp)
- PAAS is also being supported by its 50-dma. Like GDX above, it must hold it to prove that it is ready to move higher. However, the current consolidation base does not have the count necessary to take it beyond 40, and this probably means that some additional consolidation is needed.
-
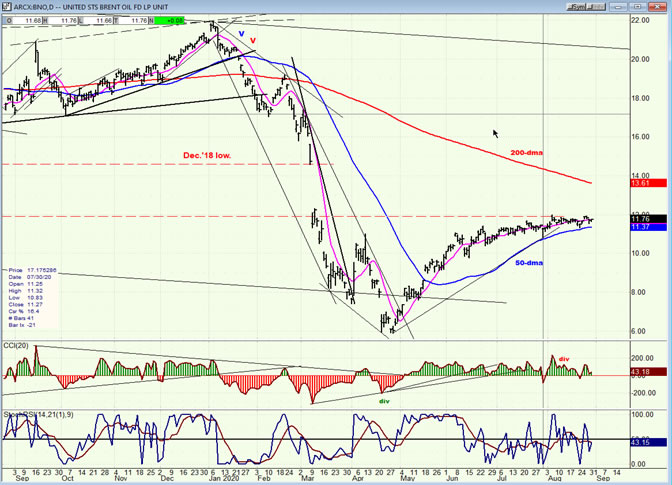
- BNO (U.S. Brent Oil fund)
- BNO is also being supported by its 50-dma. Note that breaking below it at 20 is what started the decline and breaking above it at 8.50 caused BNO to rally. Obviously, that MA cannot be underrated and if broken will result in an expansion of the base.
-
- Summary
SPX has held steadily above its 60m chart trend line ever since it started its uptrend from 3350. DJIA and QQQ have held above similar trend lines as well. It stands to reason that a break of these trend lines would start corrections in all three indices, perhaps limited in impact initially, but maybe also initiating larger corrections if stock prices respond normally to what is historically considered to be the worst month of the year for stocks.
Andre
FREE TRIAL SUBSCRIPTON
For a FREE 4-week trial, send an email to anvi1962@cableone.net, or go to www.marketurningpoints.com and click on "subscribe". There, you will also find subscription options, payment plans, weekly newsletters, and general information. By clicking on "Free Newsletter" you can get a preview of the latest newsletter which is normally posted on Sunday afternoon (unless it happens to be a 3-day weekend, in which case it could be posted on Monday).
Disclaimer - The above comments about the financial markets are based purely on what I consider to be sound technical analysis principles uncompromised by fundamental considerations. They represent my own opinion and are not meant to be construed as trading or investment advice, but are offered as an analytical point of view which might be of interest to those who follow stock market cycles and technical analysis.
Andre Gratian Archive |
© 2005-2022 http://www.MarketOracle.co.uk - The Market Oracle is a FREE Daily Financial Markets Analysis & Forecasting online publication.