


Stock Traders’ Dreams Come True – Big Technical Price Swings Pending on SP500
Stock-Markets / Stock Markets 2020 Sep 09, 2020 - 01:20 PM GMTBy: Chris_Vermeulen

RESEARCH HIGHLIGHTS:
- A potentially critical price inflection point and technical pattern setup that has nearly completed and validated over the past few days, weeks, and months.
- Potential flag/pennant formation on our Custom Valuations Index Weekly Chart shows a possible 11% to 16% (or more) downside price correction in SPY.
- Fibonacci Price Modeling system’s projects SPY downside target level near $284.50 before a bounce.
Over the past few weeks and months, my team and I have published a series of research articles suggesting the continued market melt-up was driven by speculation and the US Fed’s policies and support for the markets. We’ve also highlighted a number of technical patterns that have setup within various symbols that have generated strong warnings of a potential price reversal over the past few weeks. The biggest pattern has been the Head-and-Shoulders price patterns. The sudden downside price move in the NASDAQ, and other markets, last week caught many traders/investors off-guard. One day after a very strong rally in the US stock markets, the price reversed and sold-off nearly 6% – a shocking reversal of trend.
RED SKYS IN THE MORNING – SAILORS TAKE WARNING
Although our longer-term primary price trend modeling systems had recently flipped into a Bullish trend mode, our proprietary modeling systems indicated an extremely high risk of a volatile price correction after the S&P rallied to new all-time highs. We highlighted this research over the past few weeks suggesting the Head-and-Shoulders pattern and the “Bull-Trap” pattern may be setting up. We even published an article on September 1, 2020, suggesting the FANG stocks may be setting up for a very serious price correction. You can see our past research by clicking on the links below:
August 19: SPECIAL ALERT: MASSIVE DUAL HEAD-AND-SHOULDERS SETUP
August 23, 2020: HIGH-FLYING COVID-19 SECTORS MAY BE SETTING UP FOR A CORRECTION
September 1, 2020: ARE FANGS GOING TO BREAKDOWN SOON?
September 2, 2020: IS THE BULL TRAP COMPLETE? ARE WE FLAGGING OUT INTO A CORRECTION?
Today, we want to review a potentially critical price inflection point and technical pattern setup that has nearly completed and been validated over the past few days, weeks, and months. Although our longer-term price modeling systems are technically Bullish, we have been urging traders to “stay cautious” over the past few months. We have been urging our followers to protect open long positions and to prepare for price volatility and potential price correction.
The reason we have been urging our friends and followers is that very broad technical patterns have set up that has me and my research team concerned that the upside trend may flip into a moderately deep price correction. We don’t have any technical confirmation of this change in trend yet, but we believe we are very close to knowing if our research will be confirmed as accurate or not over the next few days/weeks.
We’ll start with our Custom Valuations Index Weekly Chart below. The double-top near 520 on this Valuations Chart, nearly five weeks ago, suggests the US stock markets actually peaked nearly a month ago in terms of organic valuations appreciation. Recently, as you can see on this chart, the Valuations levels fell from the 520 level to below the 400 level – setting up a FLAG/Pennant type of pattern.
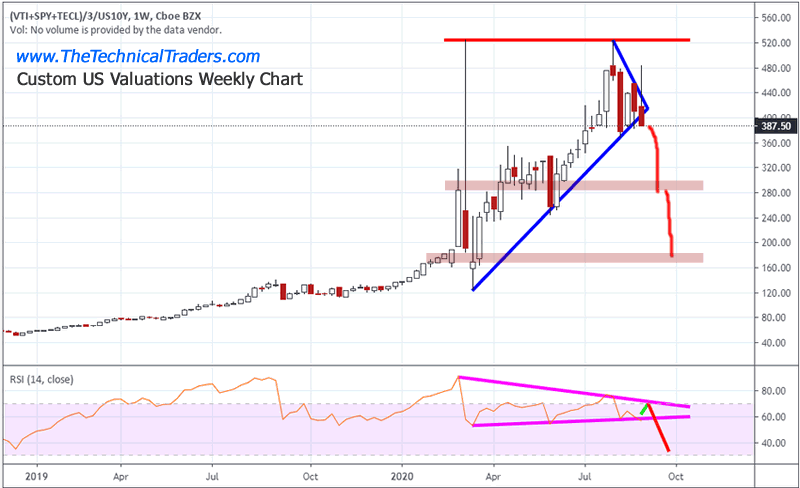
As of last week, a breakdown below the lower price channel of the FLAG/Pennant formation helps to confirm the downward price trend. Now, we need to see if this trend continues lower. If so, then we believe the US stock markets may enter a moderate 11% to 16%+ downside price correction as well. Initially, our researchers believe the 285 level on this Valuations chart will be the first level of support. Below that, the 175 level will become support.
Still, we want to be clear. We are waiting for technical confirmation and validation of this potential price correction right now. The recent downside price move over the past few days DOES NOT indicate technical confirmation or validity of these setups (yet).
This next chart is our Custom US Smart Cash Index. It highlights the Head-and-Shoulders pattern we wrote about many weeks ago as well as the technical breakdown of the upward price support channel (in MAGENTA). We’ve highlighted what our research team believes would be a proper technical confirmation and breakdown in price levels on this chart in RED – if the current setup confirms and becomes valid. You can see we’ve highlighted two levels of support. The first near 152 and the second near 134. We believe the 152 level will act as a moderately strong price floor. We believe the only way the 134 level comes into play is if there is a broader market collapse related to an unwinding of positions just ahead of the US Presidential elections and/or other concerns (think political, economic or others).
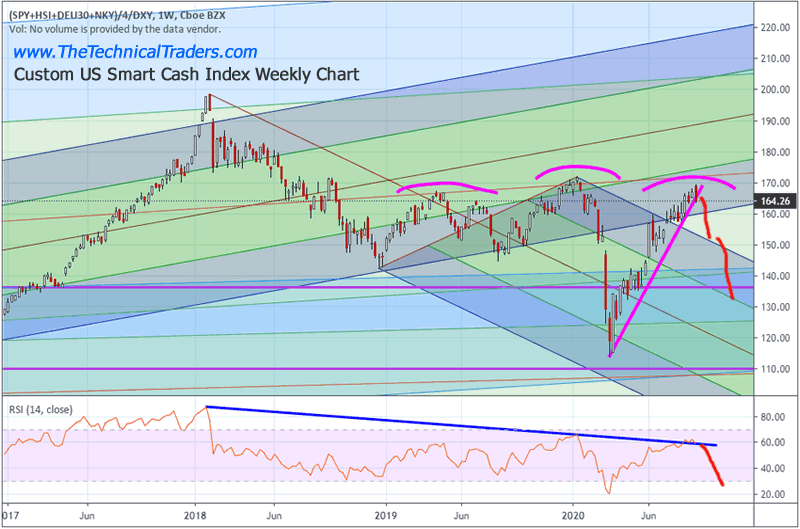
Failure to confirm or validate this Head-and-Shoulders pattern and other patterns would be a broad US market move above the recent peak in price, near the 172 level. If the markets recover very strongly over the next few weeks and rally back above the 170 level on this Smart Cash Index chart, then we would want to see the 172 level broken fairly quickly as new highs on this chart would suggest a broad market rally may continue to build momentum. If that fails to happen, then we believe the Head-and-Shoulders pattern will prompt a downside price correction of possibly 11% to 16% or more.
Before you continue, be sure to opt-in to our free-market trend signalsnow so you don’t miss our next special report!
Lastly, we are sharing our proprietary SPY Weekly chart highlighting our Fibonacci Price Amplitude Arcs and our Adaptive Fibonacci Price Modeling System, below. We want you to pay close attention to the minor LIGHT BLUE arc near the recent top in price. This Fibonacci Price Amplitude Arc originates from a future peak price level we’ve calculated and drawn on the chart well into the future. Again, because of our advanced research tools, we can attempt to identify future price targets many months or years before price attempts to reach these levels. If our research is correct, a very important Fibonacci Price Amplitude Arc is currently acting as strong resistance near the $359 level on the SPY and may attempt to prompt a downside price correction after reaching the recent peak in price.
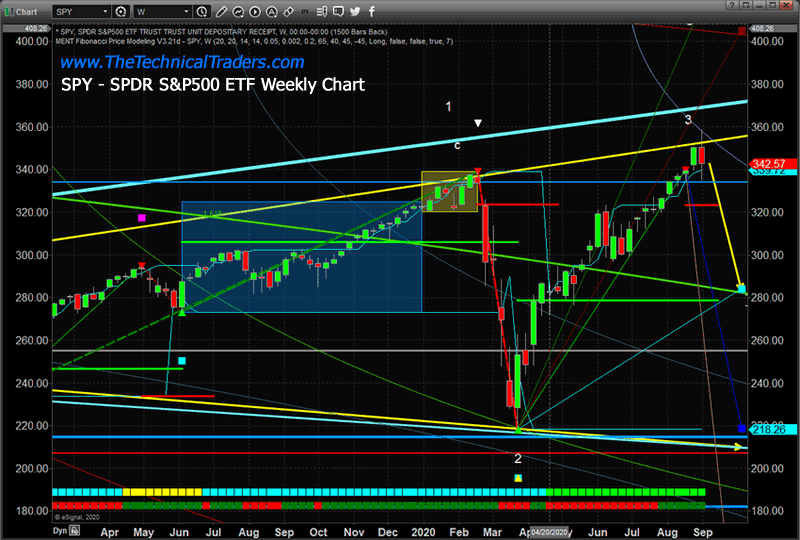
Additionally, Pay attention to the Fibonacci Price Modeling system’s projected target level near $284.50 on this chart. Although this is a very deep correction target – it is still very valid and it aligns with the GREEN Fibonacci Price Amplitude Arc level that originates from the bottom in 2009. As difficult as it might be to believe, if the downward price reversal confirms over the next few days/weeks, a very real potential for the SPY to fall toward this $284.50 level becomes valid as well.
Ultimately, from the recent COVID-19 lows, the Fibonacci Price Modeling System is suggesting an upside price target of over $400 on the SPY. This technical pattern suggests any subsequent downside price move will likely end before reaching the COVID-19 lows and prompt a bigger upside move targeting over $400 on the SPY over the next 12+months. So, the best way to think about any downside price correction at this point is “it’s just a moderately deep price correction playing out”.
We urge traders to continue to protect open long trades and prepare for increased price volatility. As we’ve been suggesting for over 18+ months, 2020 and 2021 are certain to be full of big price swings, increased volatility and full of opportunities for skilled technical traders. After this next move completes, we believe a broader market trend will emerge. This will be the type of trend that is very trade-able and efficient for skilled technical traders.
Get ready, we are about to see a big move – one way or another. The next 60+ days could present some real opportunity if you are a skilled technical trader.
If you found this informative, then sign up now to get a pre-market video every day before the opening bell that walks you through the charts and my proprietary technical analysis of all of the major assets classes. You will also receive my easy-to-follow ETF swing trades that always include an entry price, a stop, two exit targets, as well as a recommended position sizing. Visit my Active ETF Trading Newsletter to learn more.
While many of you have trading accounts, our most important accounts are long-term buy-and-hold investment accounts. Our signals can help you preserve and even grow your long term capital. If you have any type of long-term investment or retirement account and are looking for signals as to when to own equities, bonds, or cash, be sure to become a member of my Long-Term Investing Signals, which includes a weekly market update and trade alerts.
Chris Vermeulen
www.TheTechnicalTraders.com
Chris Vermeulen has been involved in the markets since 1997 and is the founder of Technical Traders Ltd. He is an internationally recognized technical analyst, trader, and is the author of the book: 7 Steps to Win With Logic
Through years of research, trading and helping individual traders around the world. He learned that many traders have great trading ideas, but they lack one thing, they struggle to execute trades in a systematic way for consistent results. Chris helps educate traders with a three-hour video course that can change your trading results for the better.
His mission is to help his clients boost their trading performance while reducing market exposure and portfolio volatility.
He is a regular speaker on HoweStreet.com, and the FinancialSurvivorNetwork radio shows. Chris was also featured on the cover of AmalgaTrader Magazine, and contributes articles to several leading financial hubs like MarketOracle.co.uk
Disclaimer: Nothing in this report should be construed as a solicitation to buy or sell any securities mentioned. Technical Traders Ltd., its owners and the author of this report are not registered broker-dealers or financial advisors. Before investing in any securities, you should consult with your financial advisor and a registered broker-dealer. Never make an investment based solely on what you read in an online or printed report, including this report, especially if the investment involves a small, thinly-traded company that isn’t well known. Technical Traders Ltd. and the author of this report has been paid by Cardiff Energy Corp. In addition, the author owns shares of Cardiff Energy Corp. and would also benefit from volume and price appreciation of its stock. The information provided here within should not be construed as a financial analysis but rather as an advertisement. The author’s views and opinions regarding the companies featured in reports are his own views and are based on information that he has researched independently and has received, which the author assumes to be reliable. Technical Traders Ltd. and the author of this report do not guarantee the accuracy, completeness, or usefulness of any content of this report, nor its fitness for any particular purpose. Lastly, the author does not guarantee that any of the companies mentioned in the reports will perform as expected, and any comparisons made to other companies may not be valid or come into effect.
Chris Vermeulen Archive |
© 2005-2022 http://www.MarketOracle.co.uk - The Market Oracle is a FREE Daily Financial Markets Analysis & Forecasting online publication.