


Stock Market SPY Expectations For The Rest Of September
Stock-Markets / Stock Markets 2020 Sep 14, 2020 - 06:06 PM GMTBy: Chris_Vermeulen

RESEARCH HIGHLIGHTS:
- Over the past 28 years, the SPY has gained an average of 3.45% in 15 of those years; it has fallen by 6.42% in the other 13 years.
- The critical support level for SPY is 332.85. If the SPY finds support at this level then you can expect continued, moderate price increases.
- Prepare for a moderate increase in volatility for the rest of September – watch the VIX.
My research team and I have been pouring over the charts in an effort to attempt to identify any support or weakness related to the increase in volatility over the past 7+ trading days. The VIX is currently at 29.71 after reaching a high of 38.28. We believe the increased price volatility is here to stay – at least through the end of 2020. This means skilled technical traders should prepare for some potentially large and aggressive price swings over the next few weeks and months.
SEPTEMBER 11 AND HISTORICAL PRICE MODELING
As we come to September 11, 2020, and reflect on the 9/11 terrorist attacks, we become more centered on what really matters in life for most of us – family, friends, health, safety, and opportunity. Even though we near a potential rotation in the market, we must never lose focus on these most essential components of our lives. Money, trading, and investing are all things that can be regained and rebuilt. Time, family, friends, community, security, and health are either impossible or extremely difficult to recover, so always keep your eye on the true prize. Now, onto the technical analysis work…
September has traditionally been a moderately weak month of trading over the past 28 years. Over this span of time, 15 of the 28 years resulted in positive price activity on the SPY averaging +3.45%. The remaining 13 of these 28 years resulted in negative price activity on the SPY averaging -6.42%. This suggests that nearly 53% of the past 28 years have resulted in a moderate upside price move on the SPY while 47% of the time, the SPY moved lower by a greater magnitude.
Our data mining application reported the following results for the month of September going back over 28 years of data:
=========================================================
Largest Monthly gain: +8.819999999999993 Largest Monthly loss: -15.420000000000016
Total Monthly Gains: 51.75497000000003 across 15 bars Avg = 3.45
Total Monthly Losses: -83.43061999999998 across 13 bars Avg = -6.42
Total Monthly Sum: -31.675649999999948 across 28 bars
=========================================================
Because the negative price activity is larger in scope than the positive price activity, we believe any downside price move in the month of September could be more aggressive, especially given the increased VIX/volatility we are currently seeing. Thus, any big breakdown in the SPY, below the recent lows near 332.85, could cascade into larger price declines.
Before you continue, be sure to opt-in to our free-market trend signalsnow so you don’t miss our next special report!
The technicals show a bullish trend for the markets with current price weakness to be shallow and weak, however, we remain cautious and a deeper price breakdown could quickly change the trend and our forward expectations. We have been warning for months that 2020 and 2021 should be full of wild price swings and big trends – yet we believe the current upside price trend is still intact and the recent downside price rotation is nothing more than a moderate price correction.
The Daily SPY chart below highlights the current support levels near 332.85 that are critical to continued Fibonacci support. A breakdown below this 332.85 price level suggests deeper Fibonacci support levels may become new targets in the near future. These lower targets are currently near 270.40 and 234.85.
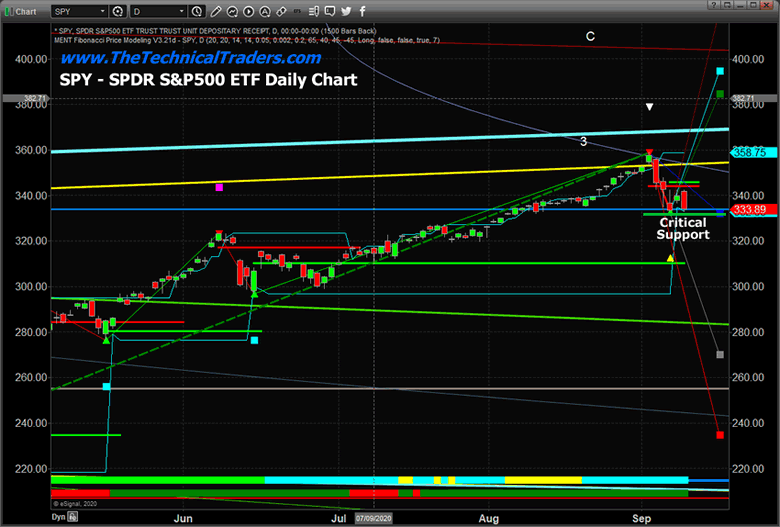
Again, to be very clear, we are still technically in a Bullish price trend from a purely technical perspective. We are cautious of the fragility of this upside/Bullish price trend and believe some price volatility is warranted after the past 5+ months of an upside price rally. Currently, our Adaptive Fibonacci Price Modeling system is suggesting the 332.85 level is critical price support. We need to see this level hold in order for price to recover to the upside fairly quickly.
In summary, be thankful for all that you do have in your life right now as we remember our fallen heros from 9/11. You must also be prepared for a potentially wild September month as historical price activity has shown that September can result in either a moderate upside price move or a much bigger downside price trend. Given the past price rally and the current start to September 2020, watch the support levels closely and be prepared for increased volatility.
If you look back at my past research, you will see that my incredible team and our proprietary technical analysis tools have accurately shown you what to expect from the market days, weeks, and months down the road. Do you want to now learn how to profit from the expected volatility and the big moves that company volatility? If so, sign up for the Technical Trader to get my Active ETF Swing Trade Signals today!
You should also make sure you protect your buy-and-hold or retirement account with our long-term technical bull/bear signals and alerts as to when to buy and sell equities, bonds, precious metals, or sit in cash. Subscribe to the Technical Investor to get my Passive Long-Term ETF Investing Signals to stay ahead of the market and protect your wealth!
Chris Vermeulen
www.TheTechnicalTraders.com
Chris Vermeulen has been involved in the markets since 1997 and is the founder of Technical Traders Ltd. He is an internationally recognized technical analyst, trader, and is the author of the book: 7 Steps to Win With Logic
Through years of research, trading and helping individual traders around the world. He learned that many traders have great trading ideas, but they lack one thing, they struggle to execute trades in a systematic way for consistent results. Chris helps educate traders with a three-hour video course that can change your trading results for the better.
His mission is to help his clients boost their trading performance while reducing market exposure and portfolio volatility.
He is a regular speaker on HoweStreet.com, and the FinancialSurvivorNetwork radio shows. Chris was also featured on the cover of AmalgaTrader Magazine, and contributes articles to several leading financial hubs like MarketOracle.co.uk
Disclaimer: Nothing in this report should be construed as a solicitation to buy or sell any securities mentioned. Technical Traders Ltd., its owners and the author of this report are not registered broker-dealers or financial advisors. Before investing in any securities, you should consult with your financial advisor and a registered broker-dealer. Never make an investment based solely on what you read in an online or printed report, including this report, especially if the investment involves a small, thinly-traded company that isn’t well known. Technical Traders Ltd. and the author of this report has been paid by Cardiff Energy Corp. In addition, the author owns shares of Cardiff Energy Corp. and would also benefit from volume and price appreciation of its stock. The information provided here within should not be construed as a financial analysis but rather as an advertisement. The author’s views and opinions regarding the companies featured in reports are his own views and are based on information that he has researched independently and has received, which the author assumes to be reliable. Technical Traders Ltd. and the author of this report do not guarantee the accuracy, completeness, or usefulness of any content of this report, nor its fitness for any particular purpose. Lastly, the author does not guarantee that any of the companies mentioned in the reports will perform as expected, and any comparisons made to other companies may not be valid or come into effect.
Chris Vermeulen Archive |
© 2005-2022 http://www.MarketOracle.co.uk - The Market Oracle is a FREE Daily Financial Markets Analysis & Forecasting online publication.