


Is The Stock Market Dow Transportation Index Setting up a Topping Pattern?
Stock-Markets / Stock Markets 2020 Sep 28, 2020 - 10:28 AM GMTBy: Chris_Vermeulen

RESEARCH HIGHLIGHTS:
- The Transportation Index, has been unusually aligned with the S&P 500 over the past 8+ months.
- Classic Japanese Candlestick top/sell reversal “Three Rivers Evening Star topping pattern” setting up.
- We may see a much bigger downside price move where price attempts to find support near 9,800 or 9,200.
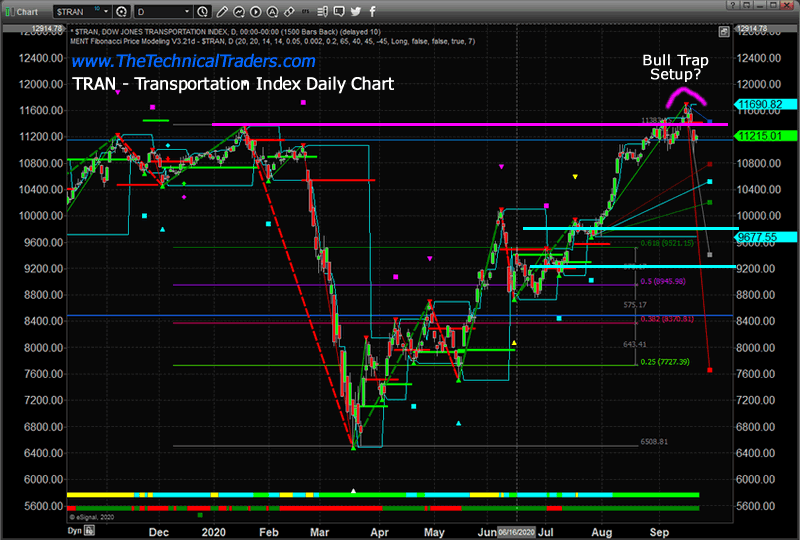
The Transportation Index, which typically leads the US stock market by 2 to 4+months, has been unusually aligned with the S&P 500 over the past 8+ months. Recently, though, the Transportation Index has rallied up to recent new all-time highs (over the past 9+ months) and has rotated lower – below resistance near 11,440 (the MAGENTA LINE on the first chart). Our researchers are warning us that any continued breakdown below this level could prompt a bigger downside market move.
IS RECENT ROTATION A TOPPING PATTERN OR JUST CONSOLIDATION?
Currently, the US stock market has rolled into a sideways/topping pattern. After the peak in metals setup near August 7, 2020, the US stock market continued to rally a bit higher, then rotated lower on September 3, 2020. The Transportation Index rolled over on September 3 but climbed higher less than 5 trading days later – breaking above the highs set before the COVID-19 peak.
We’ve suggested a “Bull Trap” pattern may be forming in the major markets and we’ve urged traders to cautious regarding the new price highs and appearance of a continued upside price rally. The Bull Trap pattern, sometimes called a “Scouting Party”, happens when price breaks above resistance (or below support) briefly in an attempt to establish a new trend. If price fails to find support after breaking above the previous resistance level, then it typically rotates lower and collapses back below the resistance level (attempting to find a lower support level).
If our research is correct, the recent rotation in the Transportation Index may suggest a Bull Trap pattern has setup and completed (with price falling back below the 11,440 level). If this trend continues, we may see a much bigger downside price move where price attempts to find support near 9,800 or 9,200.
This Daily Transportation Index chart highlights our proprietary Fibonacci Price Modeling system and the key resistance level near 11,440 (in MAGENTA). It also shows the Bull Trap setup near the recent highs. Past Fibonacci Price Trigger levels near 9,800 and 9,200 suggest any downside price move may target these levels as current support.
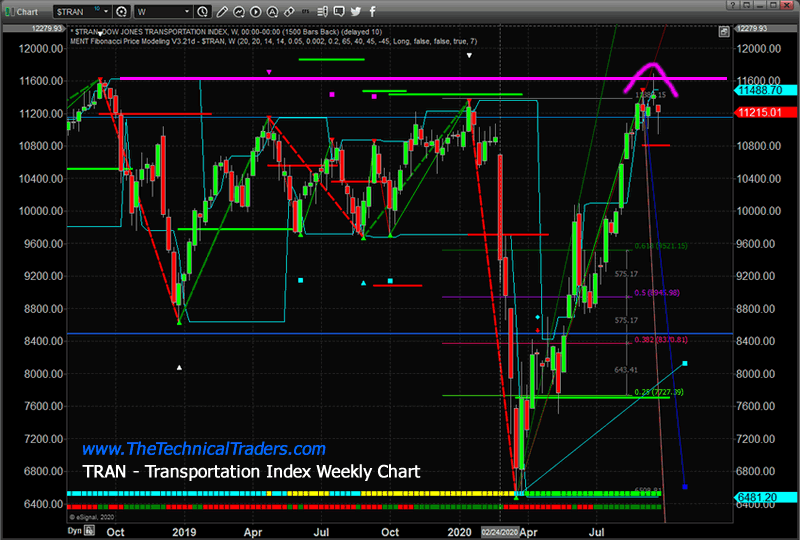
This Transportation Index Weekly chart provides a bigger picture look at the Bull Trap setup. The one aspect of the Weekly Transportation chart that we feel is critical is the 10,815 Bearish Price Trigger level from our Fibonacci Price Modeling System. This level is key to understanding if and when the Transportation Index breaks a major weekly Fibonacci trigger level. If price falls below the 10,815 level and manages to close below this level on an end-of-week basis, then we have confirmation that the longer term Fibonacci trigger level has confirmed a new bearish price trend. Right now, we don’t have that confirmation.
Before you continue, be sure to opt-in to our free-market trend signalsnow so you don’t miss our next special report!
One other interesting pattern that has set up on the Weekly Transportation Index is the Three Rivers Evening Star topping pattern. This is a classic Japanese Candlestick top/sell reversal pattern. The term “three rivers” references the confluence of two rivers joining together (think of the strength and force of the water flow) to form a new “third river”. The descriptive name of the pattern is designed to illustrate the nuanced strength that lies behind this price setup. A three rivers pattern, once confirmed, is one of the more ominous topping patterns in Japanese Candlestick price theory. It is usually associated with Doji and Hammer/Umbrella shaped price bars that are equally indicative of a price reversal.
In our past research, we authored a research article about Dow Theory and price trends that we believe should be reviewed by our friends and followers. It clearly describes the “Down Price Trend” theory and our research team’s believe that recent weakness in the US stock market may prompt a new downside price trend.
At this time, we continue to urge our friends and followers to stay cautious of volatility and price rotation. The markets are in the process of rotating – certainly. The issue for all skilled technical traders right now is “will it find support or will it break down and start a new downside price trend?”. Our researchers believe we know what will happen next, we are just waiting for technical confirmation from price activity.
Visit www.TheTechnicalTraders.com to learn how we can help you find and execute better trades and avoid risk. If you follow our research, you already know we have stayed well ahead of these trends and big price rotations in the US stock market. What’s next is even more big trends and profits for those able to engage in the best trade setups.
If you want to survive the trading over a long period of time, then you learn fairly quickly how important it is to protect against risk and to properly size your trades. Subscribers of my Active ETF Swing Trading Newsletter can ride my coattails as I navigate these financial markets and build wealth. My research and trading team are here to help you find better trades and navigate these incredibly crazy market trends.
While most of us have active trading accounts, our long-term investment and retirement accounts are equally at risk. We can also help you preserve and even grow your long term capital when things get ugly (likely now) with our Passive Long-Term ETF Investing Signals. Don’t wait until it is too late – subscribe today!
Chris Vermeulen
www.TheTechnicalTraders.com
Chris Vermeulen has been involved in the markets since 1997 and is the founder of Technical Traders Ltd. He is an internationally recognized technical analyst, trader, and is the author of the book: 7 Steps to Win With Logic
Through years of research, trading and helping individual traders around the world. He learned that many traders have great trading ideas, but they lack one thing, they struggle to execute trades in a systematic way for consistent results. Chris helps educate traders with a three-hour video course that can change your trading results for the better.
His mission is to help his clients boost their trading performance while reducing market exposure and portfolio volatility.
He is a regular speaker on HoweStreet.com, and the FinancialSurvivorNetwork radio shows. Chris was also featured on the cover of AmalgaTrader Magazine, and contributes articles to several leading financial hubs like MarketOracle.co.uk
Disclaimer: Nothing in this report should be construed as a solicitation to buy or sell any securities mentioned. Technical Traders Ltd., its owners and the author of this report are not registered broker-dealers or financial advisors. Before investing in any securities, you should consult with your financial advisor and a registered broker-dealer. Never make an investment based solely on what you read in an online or printed report, including this report, especially if the investment involves a small, thinly-traded company that isn’t well known. Technical Traders Ltd. and the author of this report has been paid by Cardiff Energy Corp. In addition, the author owns shares of Cardiff Energy Corp. and would also benefit from volume and price appreciation of its stock. The information provided here within should not be construed as a financial analysis but rather as an advertisement. The author’s views and opinions regarding the companies featured in reports are his own views and are based on information that he has researched independently and has received, which the author assumes to be reliable. Technical Traders Ltd. and the author of this report do not guarantee the accuracy, completeness, or usefulness of any content of this report, nor its fitness for any particular purpose. Lastly, the author does not guarantee that any of the companies mentioned in the reports will perform as expected, and any comparisons made to other companies may not be valid or come into effect.
Chris Vermeulen Archive |
© 2005-2022 http://www.MarketOracle.co.uk - The Market Oracle is a FREE Daily Financial Markets Analysis & Forecasting online publication.